Showing posts with label earthquakes. Show all posts

09 November, 2006

Nuclear seismology

A barely remembered anecdote, the recent talk of detecting nuclear explosions, and a Web of Knowledge search combined to bring this paper up on my screen:

Seismic tomographic inversion of Russian PNE data along profile Kraton [1]

The acronym ‘PNE’ is made more explicit in the next result:
Origin of upper-mantle seismic scattering – evidence from Russian peaceful nuclear explosion data [2]

That’s right – PNE stands for ‘peaceful nuclear explosion’, a phrase from a simpler time when people seriously advocated using nuclear explosives to dam rivers, create new anchorages, and release gas from underground reservoirs (which, shockingly, turned out to be radioactive). Both the USA and USSR engaged in this interesting pastime, but the Soviets detonated 239 PNEs against the Americans’ 28, a disparity that is probably due more to the relative power of each country’s citizenry (I suspect even in those days. if given the choice very few people would fancy a close-up view of mushroom clouds) than a difference in official enthusiasm.

Anyway, it seems some Russian geologists had the bright idea of using PNEs to undertake controlled source, wide-angle seismology on a scale not achieved before or since. They arranged to have a series of nuclear explosions set off along a number of lines (with names like 'Quartz' and 'Kraton') stretching several thousand kilometres across the USSR, along which they also deployed seismometers. Unlike reflection seismology, where only the reflected seismic energy coming directly upwards from buried discontinuities such as boundaries and faults is collected, wide-angle seismology deploys seismometers a long way from the source in order to pick up refracted seismic energy; because the speed of sound generally increases with greater depth (and pressure) in the Earth, due to Snell’s Law of Refraction downward-travelling waves eventually curve back upwards towards the surface. If you get far enough from the source, not only will a seismometer pick up these deep-diving waves when they reach the surface, but because of their higher average speed these waves will actually reach that seismometer before ones that have travelled at shallower depths. The distance from the source at which the ‘first arrivals’ from different depths first appear provides a great deal of information about the velocity structure, and hence the physical structure, of the subsurface rocks along the survey line (simply put, earlier appearance of deep waves=faster velocities – although obviously it’s a bit more complicated than that, especially when you factor in the presences of sharp discontinuities in wave-speed across lithological boundaries).

Methodology wise, there is quite a large overlap between these wide-angle techniques and earthquake seismology. However, because the source in this case is man-made, you minimize some of the major uncertainties which limit resolution when your source is a natural earthquake: the exact time and location that the source wave was generated, and the nature of the original signal (as I’ve discussed in the context of the North Korean test, man-made seismic signals are generally much shorter and simpler than an earthquake signal). The frequency of the signal is generally higher, too, which also improves resolution. There is however, one major drawback: the airguns (or less commonly nowadays, conventional explosives) used in seismic experiments produce orders of magnitude less energy than an earthquake does, meaning that pretty much all of the waves penetrating below the crust-mantle boundary (Moho) –about 35-40 km below the surface in normal continental crust - dissipate before they can get back up to the surface. The figure below shows the inferred paths of seismic waves picked up along a wide-angle survey line in the Aleutian Islands (the source is located in the centre, the scales are in km) [3].


Whatever your feelings about the rationality of using nuclear bombs in this way, you can’t deny that they’re going to generate a hell of a lot more energy, allowing signals from deep in the mantle to be received back at the surface. Here’s a similar figure for the ‘Kraton’ PNE seismic line (from [1]. Note the change in horizontal as well as vertical scale: whereas seismometers 2500 km away from the source are fairly pointless for normal wide-angle surveys, for a PNE shot this is about the point that first arrivals from the 660 km discontinuity start arriving. Which I can’t help being a little bit impressed by.


The second of the two papers I’ve cited concentrates on the uppermost mantle, 100-200 km beneath the Earth’s surface. The waves travelling through this region appear to be travelling slower than in the overlying rock, and are also being scattered a lot, resulting in noisy first-arrivals data (the relationship between the arrival time and the distance from the explosion is not linear). The authors propose that this is because the mantle at this depth is partially molten. It seems that the unique data generated by these 30-40 year-old experiments is still reaping dividends, now that scientists worldwide can access them and apply the latest processing tricks.

References
[1] L Neilson et al., Geophysical Research Letters 26(22), p 3413-16, 1999.
[2] L. Neilson et al., Geophysical Journal International154, p 196-204, 2003.
[3] D Shillington et al., Geochemistry Geophysics Geosystems 5, Q10006, 2004 [doi]

16 October, 2006

What caused the Hawaiian earthquake?

Far be it for me to refuse a request. In the comments to my last post:

I can't find an email address for you or a more appropriate place to post a question. I'm looking for someone, anyone, who has any ideas about the cause of Sunday's Hawaiian earthquake. I've posted the question on my blog at ElementList [where there is a very cool photo of a rockfall triggered by the quake]. The quake was very deep (~38 km) and was strike-slip. This seems like an odd place for that kind of quake. Any ideas?

This is an interesting one – I should warn that most of what follows will be speculation (informed speculation, perhaps…). First, lets have a look at the USGS moment tensor solution:


Note that the depth is now being reported as 28 km, which is deeper than a lot of the normal seismicity, but not unusually so. However, the size and the location of this earthquake are both unusual. For comparison, here’s a map of seismicity on the Big Island for the year 2000 (from the Hawaii Volcano Observatory).


As you can see, earthquakes are hardly rare on Hawaii; the emptying and filling of magma chambers, and molten rock moving to the surface, all produce stresses which result in earthquakes. However, they are pretty much all less than magnitude 4, more than 400 times less powerful than today’s 6.6. Also noteworthy is that a lot of the seismicity is concentrated underneath the volcanoes, as you would expect if it is associated with magma movement; in contrast, today’s quake and aftershocks, as shown in the figure below (source) were located off the NW coast of the Big Island.


All of this suggests that this earthquake is not associated with the volcanism. So what is the cause? Two possibilities spring to mind:
  • The Hawaian islands are 5 km-high piles of basalt that represent a very large load on the oceanic crust and lithosphere beneath them, causing it to bend downwards around the bases of the seamounts. The earthquake could be releasing some of the stress building up as the islands continue to grow.
The problem with this is the focal mechanism, which is almost pure strike-slip (horizontal displacement only); you'd expect at least some vertical (extensional) motion if gravitational collapse was involved (much like these, in fact)*. Which leaves option two:
  • Although most deformation on the Earth occurs at plate boundaries, some stresses are still transmitted to the interior of plates, where they cause intra-plate earthquakes at weak points. It could be that the crust around Hawaii is such a weak point. My first thought that this was an effect of the hotspot volcanism (lots of cracks for magma migration, etc.). But then another thought occurred. Here’s a bathymetric map of the Northern Pacific:


    See those long, linear features? They’re oceanic fracture zones, the inactive parts of the transform faults which separate the spreading centres of mid-ocean ridges (these Pacific ones eventually join the East Pacific Rise just off the west coast of the Americas). And one of these fracture zones, the Molokai Fracture Zone (rather bizarrely abbreviated as OFZ in this particular image) just happens to intersect with the Hawaian Islands. It’s quite common for inter-plate earthquakes to occur on old faults, as they’re much weaker than surrounding rock, and the focal plane solution is consistent with an E-W trending structure.

So that’s my guess: this earthquake is accommodating large-scale, intra-plate strains in the Pacific plate (shifting up into really speculative, I’ll note the nice correlation to the ~NW absolute motion of the Pacific plate - see here for example), and may be due to reactivation of an old fracture zone, or a structure associated with it. More knowledgeable heads are free to weigh in and correct me...

[Update: Western Geologist has a good post up pointing out that there's a big difference between the USGS focal mechanism given above and the Havard CMT solution, the latter indicating an oblique extensional fault - more consistent with the quake being a response to plate loading - rather than strike slip and suggesting that the focal planes may not be well constrained. He's also dug out the locations and mechanisms of other large (non-volcanism related) quakes in the last 20 years, and discusses how they relate to this weeks'.]

12 October, 2006

Some updates

More info on the North Korean nuclear test (or ‘tesr’, as it was in my title for a couple of days): Jake points to CNN report that it was supposed to be a 4 kiloton device - that’s what the Chinese were told by North Korean officials before the test, anyway. If a 10-15 kT device generates a magnitude 5, magnitude 4.2 would represent a yield of 1.6-2.4 kT (very rough calculation – it’s a logarithmic scale, and the starting figure isn’t exactly precise), so it’s a little on the low side, indicating something didn’t go right (it’s not completely impossible that some bizarre combination of large cavity size and local geology led to very inefficient conversion into seismic waves, but that would be mighty convenient). Arms Control Wonk has some speculations on what - plutonium is much more tricky than uranium, it seems. Meanwhile, the Lab Lemming takes the time to debunk the hysteria over a possible second test (quite how a subduction zone earthquake off the Japanese coast got mixed up with a shallow explosion on the Korean Penisula is beyond me - when I first heard this rumour I just looked up the USGS map of recent activity - which clearly just shows Monday's event - and that was that).

Further to my rant about Truth in Science, I was glad to discover that there’s more than a few of us who aren’t going to let their false appeal to ‘balance’ fool anyone. The British Centre For Science Education have a whole section devoted to Truth in Science, and they’ve dug up some interesting facts about the clear creationist roots of the major players in this organisation as well as joining in the debunk-fest. Science, Just Science are also on the case, with a whole topic in their discussion forums. It’s nice to know I’m not the only one worrying about this; although we may not be quite as infected with the creationism meme over here, we don’t have that pesky separation of church and state thing either.

10 October, 2006

North Korean nuclear test

See also my update

Lab Lemming asks whether seismology can say anything useful regarding North Korea’s nuclear test. You’d certainly hope so, as monitoring of the Comprehensive Test Ban treaty relies upon it. An earthquake, where rock slides along a fault plane, generates both compressional (P) and shear (S) waves (but generally more of the latter), and patterns of compressional and dilational first motions in the P waves (which are the basis of the beach ball-like focal mechanisms I’ve discussed previously). Explosions basically just push the rock outwards in all directions, producing lots of P waves, not many S waves and a focal mechanism which looks like a big solid circle.

The USGS has confirmed that they detected a seismic event, magnitude 4.2 , which appears to correspond to the test, but they have yet to generate a focal solution (they don’t usually bother for events smaller than about magnitude 5, probably because the signal received at distant stations is too weak to reliably measure first motions). However, the Western Geologist has dug up some seismograph data from here, which I’m just going to lazily reproduce: the first graph is the North Korea event, the second is a recent earthquake for comparison (each line represents one station, which are different distances away, hence the time difference).


P waves are faster than S-waves, so will be the first to reach the station. It seems that for the North Korea event, a lot of the seismic energy received is in the first 10-15 seconds, and the signal dies out quite quickly after that. In contrast, the signal for the Japanese earthquake is received for more than 2 minutes, and the first peak is much less pronounced, suggesting that more energy is arriving in the form of slower S waves, and significant (above background) vibrations are received for a much longer period.

So, it seems likely that this is indeed an explosion, although that says nothing about whether the device actually worked; that would depend on knowing what the intended yield was, and even then it’s tricky, because not all of the energy released will be converted to seismic waves. This uncertainty may be behind the large discrepencies between the various estimates of the size of the explosion reported by New Scientist (see also the discussion at No Se Nada), which has led to speculation that the bomb might have ‘fizzled’. For what it’s worth, one of the textbooks on my desk says that a Hiroshima-size device (10-15 kT TNT equivalent) should generate a magnitude 5 quake, so if it didn’t fizzle, it seems to have been quite a small nuke.

31 July, 2006

A genuine quake prediction, or inspired guesswork?

Via geology.com news, I’ve come across an interesting article in Geotimes about a possible case of successful earthquake prediction:

For nearly three decades after Chinese officials predicted the powerful earthquake that hit Haicheng in the north of China on Feb. 4, 1975, details of their prediction process remained closely guarded. But now, after gaining access to formerly classified documents and key people involved with the process, a team of scientists has reconstructed this important event …

…In this month's issue of the Bulletin of the Seismological Society of America, however, Kelin Wang, a senior research scientist at the Geological Survey of Canada in British Columbia, and colleagues say the prediction was legitimate. The Haicheng earthquake is the "first, and so far only, case where a large earthquake was predicted," says Susan Hough, a seismologist with the U.S. Geological Survey in Pasadena, Calif.

Wang's team reviewed relevant documents and interviewed key witnesses in the prediction process to compile a detailed account of the events and decisions that led to the Haicheng prediction and evacuation. The team wrote that the prediction was "a blend of confusion, empirical analysis, intuitive judgment, and good luck."

The empirical analysis part involved the use of data collected about a series of large earthquakes which hit northern China in the 1960s. It appears that Chinese seismologists identified a number of tectonic events which preceded these earthquakes, which they then started to see again:
By June 1974, based on precursory anomalies that included a shift in land levels in the nearby Bohai Sea area, officials issued the first of two "middle-term" predictions that warned of an earthquake within one to two years.

So far, so scientific, but then we get into the intuition and luck:
No official "short-term" predictions — warning of an earthquake within a few months — were made, the team says, but some Chinese officials made "imminent" predictions, based on an increase in foreshock activity in the 24 hours before the main shock.

A large earthquake is usually not an isolated event, but occurs as the biggest ‘mainshock’ in a cluster of earthquakes in the same region. Aftershocks occur as the crust around the main fault rupture adjusts to the sudden displacement, and sometimes (not always) you get foreshocks as well – smaller earthquakes that precede the main event. The problem is that the foreshock-mainshock-aftershock subdivision is based only on the relative magnitude of the earthquakes in the sequence, and can thus only be applied restrospectively; if you show a seismologist the data from just one particular earthquake in isolation, they would not be able to tell you whether it was the foreshock to a larger event, the mainshock itself, or an aftershock. In Haicheng, it seems the officials saw increasing earthquake activity and decided it preceded a larger event, leading to their warning, but there was a lot of luck involved in this particular ‘prediction’. And it’s not clear whether it can entirely take the credit for drastically reducing the death toll anyway.
Although the imminent predictions correctly identified the quake's location, they did not specify a time, and they underestimated the quake's magnitude. Nonetheless, the predictions — along with some actions taken spontaneously by local citizens [due to education programs initiated after the 1960s quakes]— triggered warnings and evacuation orders around the area where the earthquake eventually occurred. According to the team, the evacuations, along with the durable style of housing construction in the area and the time of the main shock — 7:36 p.m., when most people were neither at work nor sleeping — saved thousands of lives.

Nonetheless, we see once again that the problem is not that there aren’t earthquake precursors (although some are more established than others), it’s reliably spotting them before the event, and understanding what (if anything) they are saying about its imminence.

19 July, 2006

Latest earthquake in Java

Monday saw another tsunami hit Indonesia, triggered by an earthquake offshore. But what more can we say about this quake? We can immediately use our knowledge about earthquakes and plate tectonics to make some basic predictions:

The earthquake will probably be due to movement along a thrust fault, probably associated with the Sunda trench. Tsunamis are caused when vertical (up and down) motions of the ocean bottom associated with an earthquake displaces the water above, creating a large wave. Vertical motions occur on contractional (thrust) and extensional (normal) faults. Java is close to a convergent plate boundary, so the earthquake is most likely to be on a thrust fault associated with this subduction zone.

The epicentre will be shallow. In order to cause a tsunami, the fault rupture must have propogated up to the ocean bottom, suggesting that it initiated at a fairly shallow depth.

Here's the USGS moment tensor solution:


Lo and behold, a shallow thrust (6 km may not seem particularly shallow, but at a subduction zone you can get earthquakes down to several hundred km) close to the Sunda Trench. The beachball like focal mechanism shows a thrust, and is very similar to that for the Boxing Day 2004 Earthquake (see also my previous post on seismology in this region).

Thus we have simulataneously demonstrated both the power and the impotence of plate tectonics at present. The fulfilment of my predictions shows that this earthquake fits in well with our overall tectonic picture of the region, but it is only a retrospective understanding; on Sunday, there was no way of predicting that an earthquake of that particular size would occur in that particular location.

30 May, 2006

Earthquake in Java

When they first heard news of Friday's earthquake in Java, many people's first reaction was undoubtedly to wonder if this latest event is in any way related to the Boxing Day 2004 quake. Here's some information on Friday's earthquake, courtesy of the National Earthquake Information Center (more specifically, here):


This image shows both the earthquake's location and a beachball-like symbol, known as a focal mechanism, which indicates the type of fault generating the earthquake. More in this in a minute, but first lets look at the same information for the Boxing Day Earthquake (full summary here).


You should ignore the magnitude, which was actually 9.0 - the automatic system which generates this information estimates magnitudes from the amplitude of seismic waves of a particular type and frequency, which are saturated (can’t get much bigger) for very large earthquakes and hence lead to an under-estimate.

The Boxing Day tsunami was caused by a rupture of the subduction megathrust at the boundary between two tectonic plates, just off the Indonesian coast. This is obvious from the fact that the hypocentre (point of first rupture) is very close to the Sunda trench, which is where the megathrust breaks the surface. It is also obvious from the focal mechanism, which is an idealised plan view of the movement associated with the earthquake, divided into compressional (solid areas of the beachball) or dilational (white) zones. This distribution is constructed by combining the directions of first motion, compared to the direction of the source, received by the global seismometer network; this will vary depending on the relative position of the station. The dividing lines between the solid and white zones represent the two possible fault planes along which this motion occurred - movement along either of these planes can produce the same focal mechanism (for slightly more detail, see here or here). The focal mechanism for the Boxing Day 2004 earthquake is a thrust fault - there is a compressive zone in the centre of the beachball which shows that shortening of the crust is occurring along either a very steep, or very shallow, thrust plane. Because we know it was at a subduction zone, it's probably the latter (the megathrust is normally shallowly dipping - see my previous post on subduction zones).

However, looking back at the information for Friday's earthquake, you can see that it is located much further away from the trench, in the forearc region of the overriding plate. Also, the focal mechanism is completely different; the pattern of compression and dilation implies horizontal strike-slip along a vertical fault plane. This indicates that this earthquake did not occur at the megathrust on the plate boundary.

However, things start to get interesting if we look at the relative motion across this boundary, which, as the figure below indicates, is generally oblique to the trend of the Sunda Trench. In contrast, the motion at the subduction megathrust (as indicated by the Boxing Day focal mechanism, and the focal mechanism of the 28th March earthquake in the adjacent section of the subduction zone) is almost exactly perpendicular to that trend. It seems that motion along the megathrust cannot account for all of the relative plate motion. However, the 'left-over' motion (see inset) can be accommodated by events like Friday's earthquake, if we assume a NW-SE-trending fault.


This phenomenon - different parts of the plate motion being taken up by separate sets of faults - is known as strain partitioning, and is very common in regions of oblique subduction. Thus the two events can be viewed as complementary - the strike slip fault in the forearc region is taking up the component of plate motion that the subduction thrust does not. The Boxing Day earthquake did not directly cause Friday's earthquake, but a study of its focal mechanism clearly requires events like it.

15 May, 2006

Algae and earthquake precursors

An interesting report from the BBC last week:


Concentrations of the natural pigment chlorophyll in coastal waters have been shown to rise prior to earthquakes.

These chlorophyll increases are due to blooms of plankton, which use the pigment to convert solar energy to chemical energy via photosynthesis.

This is based on an article by Singh et al. [doi] in Advances in Space Research, the current issue of which seems to be devoted to the use of satellite remote sensing for studying and predicting natural hazards such as earthquakes. The authors claim that you can detect a rise in sea surface temperature just before large coastal earthquakes. The blooms observed in this study are, they say, result from an increased flow of heat energy from the ocean to the atmosphere, enhancing the upwelling of cold, nutrient rich water and fuelling a boom in the growth of photosynthetic algae.

This is all very interesting, but what is unclear in the paper is the reason so much heat energy is being released prior to the earthquake, which is itself releasing accumulated strain energy. And, looking at the paper, I'm not really sure the relationship is quite as clear-cut as is claimed. The figure below is from their paper, which shows the amount of upwelling measured at three localities in the month in which an earthquake was recorded. The peaks can be linked to increased concentrations of chlorophyll, as measured by satellite. The dark vertical lines mark the date of the earthquake.


As you can see, there are a number of peaks in each of these plots, not just the one associated with an earthquake. In all but perhaps the last case the peak preceding the earthquake doesn't seem to have a significantly different magnitude to all the others, and the timing of the earthquake seems quite variable - in one case it coincides with the peak, in another it is ten days afterwards.

You may beg to differ, but I'm rather unconvinced by this. It seems on a par with other proposed earthquake precursors like low frequency EM fluctuations (on which there are also some papers in this issue of Space Science Research) - not only is it not clear how they work, but the supposed precursor signals are not obviously distinguishable from background. Sadly, I don't think we'll be using satellite data to reliably forecast earthquakes just yet.

22 February, 2006

The critical wedge and seismic hazards at subduction zones

In my post about misconceptions in geology, I introduced the idea that rather than a specific prediction, seismologists concentrate more on estimating the likelihood of large or destructive earthquakes over a certain time period, or the seismic hazard. Subduction zones accommodate large amounts of relative motion between the two plates they separate. Also, this relative motion mostly occurs on a single shallowly-dipping fault, with a large surface area (sometimes called a megathrust), where one plate is thrust underneath the other. Both of these features suggest that the seismic hazard of subduction zones can be quite high. In an earthquake cycle, the area around a fault deforms elastically until enough strain energy is built up to overcome frictional forces across the fault itself, and this energy is released in an earthquake. If large amounts of motion are being accommodated by a single fault, the strain build-up will be large and rapid, and could be potentially released in a single large earthquake.

However, it turns out that not all subduction zones, or even sections of subduction zones, are created equal. Along some segments, infrequent large ruptures which can potentially cause tsunamis occur, in other places earthquakes occur more often and are therefore smaller (because there has been less time for strain to build up across the fault). The seismic coupling of the subduction thrust, the ratio of the estimated slip released in earthquakes to the overall relative plate motion, is also quite variable, implying that at some subduction zones a significant amount of deformation is being accommodated either by aseismic slip (which is gradual and therefore does not cause earthquakes) on the subduction thrust, or by deformation within the accretionary wedge. Understanding the causes of this variation is obviously important for accurate estimates of the seismic hazard at subduction zones. In this month’s Geology, Fuller et al.[1] provide some insight into this problem by using, and extending, the concept of the critical or Coulomb wedge.


The diagram above illustrates a simple model of a subduction zone, with a basal thrust dipping at angle b and a wedge of accreted sediments on the overriding plate. In this configuration, where deformation occurs is governed by the balance between the frictional strength of the basal thrust, and the strength and shape of the accretionary wedge. If the rocks in the wedge are weaker than the thrust, then some inter-plate motion can be accommodated by folding and small-scale faulting in the wedge, rather than causing strain to build up across the subduction thrust, and reduce the risk of large earthquakes. But this is only true if the slope, or taper, of the wedge (a in the figure above) is below a certain value. Once the wedge reaches this critical taper its internal strength cannot support steeper slopes against the force of gravity; it can therefore no longer deform internally, and deformation will now be concentrated on the basal thrust.

This model provides some insight into why seismic coupling might vary along a subduction zone; areas of low seismic coupling might be areas where the wedge has not yet reached a critical taper, allowing more deformation to be accommodated away from the basal thrust. Also, wedges with steep topography may indicate a stronger basal thrust; the stronger the subduction thrust is, the greater the frictional forces that need to be overcome, and the larger the eventual earthquake can be.

Fuller et al. were investigating the observation that along some subduction zones, areas of high seismic coupling (also known as asperities) are associated with forearc basins, which are formed by downwarping of rocks on the upper plate. They realised, and confirmed with some numerical modelling, that if you take into account the increasing dip of the slab, b, away from the trench, formation of these basins is actually a consequence of critical wedge theory; as b increases, the critical taper decreases and can eventually become negative, causing the slope to change direction and form a forearc basin (factors such as the overall strength of the basal thrust and the wedge also affect the critical taper, so this does not have to happen).


Further modelling shows that if this basin was then filled with sediment, the taper of the wedge would be increased a long way above critical. This allows larger strains to build up on the subduction thrust, because there is no possibility that any deformation can be accommodated in the wedge. This neatly explains why subduction zones with well developed forearc basins show a higher degree of seismic coupling.

I really like the way that the authors have taken a simple model, which I learnt about as an undergrad, applied it to a more realistic situation, and used it to explain some aspects of subduction zones in a new way.

[1] Fuller, C.W, et al. (2006). Geology 34(2), p 65-68.

02 February, 2006

Annoying misconceptions in Geology

Scienceblogs has recently accumulated some of my favorite stops in the blogosphere into one convenient portal, and introduced me to a few more well worth reading, such as Uncertain Principles. A recent post (and growing comments thread) discusses irritating misconceptions in science. Maybe it's the fact that I'm marking exams at the moment and it's put me in a bad mood, but once I started, I couldn't stop thinking of geological examples. Here's my list, in no particular order of non-preference.

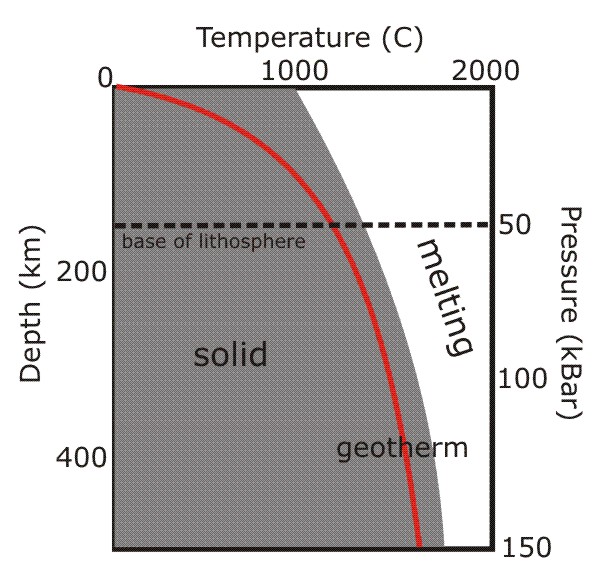
Tectonic plates move around on top of a sea of molten lava. Many people mistakenly believe that the beneath the Earth's crust lies a seething mass of molten lava, ready to erupt at any minute. Not true. As the figure below shows, although the temperature of a rock does increase with depth (as shown by the red line, the geotherm), so does its melting point due to the immense pressure exerted by tens of km of rock piled on top of it.


As you can see, at no point does the geotherm cross the solidus (the temperature at which melting would start), so the rocks remain solid even at great depths. However, below about 150-200km, the geotherm gets quite close to the melting point, which allows rocks to more easily deform and flow (a process known as creep). Think less molten lava, more Silly Putty. Mantle convection can therefore occur below this depth, even though the rocks are not melted. The more rigid, non convecting rocks above this boundary form the lithosphere, which forms the major part of tectonic plates (the crust is just a skin on top).

Melting to form magma, and hence volcanism, only occurs when something happens to disrupt this situation; three common ways that this happens are shown below. The geotherm can cross the solidus by being shifted upwards by rifting (which thins the lithosphere and allows upwelling of hotter mantle to shallower depths), or across by a mantle plume (an upwelling of hotter material from deeper within the Earth). The melting point of the mantle rocks can also be reduced by a change in composition; at subduction zones, this is caused by the addition of water from the downgoing plate.


This is the reason why volcanoes only occur in particular geological environments on the Earth's surface, rather than everywhere.

What earthquake and volcano 'prediction' actually means. Sorry folks, but it's never going to get to the stage where we can point to a particular volcano or fault and say, "this will erupt/rupture next Thursday at 11:00". For both volcanoes and faults, geologists can try and reconstruct the past history of eruptions and earthquakes, to see how regularly they happen. They can also watch for signs of imminent activity: the filling of a volcano's magma chamber might be accompanied by small earthquakes and ground uplift; the build-up of strain across a fault can be monitored by GPS. This gives some clues as the the liklihood of something happening, but it's just that - a probability, not a certainty. So the most precise forecast you're ever going to get is, "there's a high (or low) likilihood of rupture/eruption in the immediate future". And, particularly for earthquakes, "immediate future" could well mean "in the next decade or two"...

There is one 'geological column' for the whole Earth. The geological timescale divides the 4.5 billion years of earth history into distinct chunks, based on changes in environment or dominant forms of life over time. However, this does not mean that every rock of a particular age is the same. Just like today, in these periods many different processes were leaving their own unique record; marine deposits formed in shallow seas, deltas built out from coastlines, deserts formed vast dune fields. In other places, uplift of ancient mountain ranges led to no deposition, and erosion of rocks that had been laid down in earlier times. So there is no one geological column; each area has its own unique sequence of rock types, often with large time gaps in between different units. Correlating them all with each other is one of the major tasks of the geologist.

All radiometric dating is 'carbon dating'. This has cropped up in the exams I'm currently marking - I'm assuming (fervently hoping!) that it's not due to anything I said in the lectures, and it just reflects the generally held notion that all radiometric dating involves 14C. It's the isotope most people have heard of, because it is so widely used in archaeology. However, trying to 'carbon date' rocks is generally pointless; 14C has a half-life of 5,730 years, which means after about 50,000 years it has virtually all gone. Assuming there was anything to begin with, of course; there's not generally much carbon in volcanic rocks. This doesn't matter, because there's a whole array of different isotopes with half-lives much better suited to dating rocks tens of millions of years old.

Blowing up Earth-bound comets and asteroids at the last minute will save the day.. Nope, we'd still be doomed (OK, this is tenuous geologically, but it does annoy me).

A geologist can tell you the life story of a random pebble you've picked up on the beach. Don't get me wrong, pebbles can be useful - they tell you about local rock types along that section of coast, for one thing, which is very handy when you're mapping. Just don't be disappointed when the most information you get from me is 'sandstone'.

Well, that's the list so far...additions are welcomed.