

Since I last talked about UK energy policy, the government has released a consultation document (available here) entitled 'Our Energy Challenge - Securing clean, affordable energy for the long-term'. It weighs in at 77 pages, mainly because it spends much of it’s time repeating itself, but offers a good insight into the argument the government is likely to be making as it tries to convince us that nuclear power is the one, true way.
The report, starts off by reiterating the goals laid out in the 2003 Energy White Paper 'Our energy future – creating a low carbon economy':
With reference to the first goal, the report is quick to boast that “The UK remains one of the few European countries on track to meet its Kyoto commitment to address climate change”; however, it also presents figures which should severely curtail any smug laurel resting. Between 1991 and 2000 there was a relatively steady drop in CO2 emissions from 210-180 Mt/yr, due to the switch from coal- to gas-fired electricity generation in the 1990s. Since 2000, however, emissions have remained relatively flat (although still below our Kyoto target of 12.5% below 1990 emissions levels).
To make things even worse, emissions are currently projected to stay at similar levels out to 2020, which can hardly be described as ‘real progress’. There are several causes for this current and projected stasis:
This situation is not just worrying from an environmental perspective. The increased reliance on gas at a stage when our own reserves in the North Sea are starting to wane also raises concerns in the ‘energy security’ arena, because we’d be relying on overseas suppliers (mainly Russia, the Middle East and Africa) to supply most (possibly 90% by 2020) of the fuel for our power stations as well as the domestic heating market, which also primarily uses gas. Economically, this is a compromising position to be in.
These facts combine to produce what will undoubtedly be the government line following the ‘consultation’. If we are to cut emissions, and if we are to enjoy more energy security, we want to avoid moving to such a heavy reliance on gas in the next two decades. Reducing energy usage is impractical, so we need to change how that energy is generated. Renewables can’t cut it (contrast the 20 GW shortfall predicted for 2020 with the 500MW of renewable wind capacity added to the National Grid last year). Nuclear is proven technology, cuts emissions and means that we are not hostage to the whims of overseas suppliers. To reduce emissions further we can combine this with carbon sequestration – pumping our CO2 into empty oil and gas reservoirs rather than releasing it into the atmosphere.
Well, it’s a strategy. But, as I’ll try to show in my next post, it’s a pretty stupid one.
27 February, 2006
Government warms up its argument for nuclear power
22 February, 2006
The critical wedge and seismic hazards at subduction zones
In my post about misconceptions in geology, I introduced the idea that rather than a specific prediction, seismologists concentrate more on estimating the likelihood of large or destructive earthquakes over a certain time period, or the seismic hazard. Subduction zones accommodate large amounts of relative motion between the two plates they separate. Also, this relative motion mostly occurs on a single shallowly-dipping fault, with a large surface area (sometimes called a megathrust), where one plate is thrust underneath the other. Both of these features suggest that the seismic hazard of subduction zones can be quite high. In an earthquake cycle, the area around a fault deforms elastically until enough strain energy is built up to overcome frictional forces across the fault itself, and this energy is released in an earthquake. If large amounts of motion are being accommodated by a single fault, the strain build-up will be large and rapid, and could be potentially released in a single large earthquake.
However, it turns out that not all subduction zones, or even sections of subduction zones, are created equal. Along some segments, infrequent large ruptures which can potentially cause tsunamis occur, in other places earthquakes occur more often and are therefore smaller (because there has been less time for strain to build up across the fault). The seismic coupling of the subduction thrust, the ratio of the estimated slip released in earthquakes to the overall relative plate motion, is also quite variable, implying that at some subduction zones a significant amount of deformation is being accommodated either by aseismic slip (which is gradual and therefore does not cause earthquakes) on the subduction thrust, or by deformation within the accretionary wedge. Understanding the causes of this variation is obviously important for accurate estimates of the seismic hazard at subduction zones. In this month’s Geology, Fuller et al.[1] provide some insight into this problem by using, and extending, the concept of the critical or Coulomb wedge.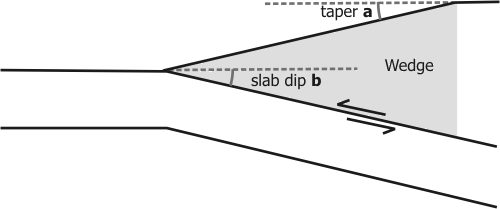
The diagram above illustrates a simple model of a subduction zone, with a basal thrust dipping at angle b and a wedge of accreted sediments on the overriding plate. In this configuration, where deformation occurs is governed by the balance between the frictional strength of the basal thrust, and the strength and shape of the accretionary wedge. If the rocks in the wedge are weaker than the thrust, then some inter-plate motion can be accommodated by folding and small-scale faulting in the wedge, rather than causing strain to build up across the subduction thrust, and reduce the risk of large earthquakes. But this is only true if the slope, or taper, of the wedge (a in the figure above) is below a certain value. Once the wedge reaches this critical taper its internal strength cannot support steeper slopes against the force of gravity; it can therefore no longer deform internally, and deformation will now be concentrated on the basal thrust.
This model provides some insight into why seismic coupling might vary along a subduction zone; areas of low seismic coupling might be areas where the wedge has not yet reached a critical taper, allowing more deformation to be accommodated away from the basal thrust. Also, wedges with steep topography may indicate a stronger basal thrust; the stronger the subduction thrust is, the greater the frictional forces that need to be overcome, and the larger the eventual earthquake can be.
Fuller et al. were investigating the observation that along some subduction zones, areas of high seismic coupling (also known as asperities) are associated with forearc basins, which are formed by downwarping of rocks on the upper plate. They realised, and confirmed with some numerical modelling, that if you take into account the increasing dip of the slab, b, away from the trench, formation of these basins is actually a consequence of critical wedge theory; as b increases, the critical taper decreases and can eventually become negative, causing the slope to change direction and form a forearc basin (factors such as the overall strength of the basal thrust and the wedge also affect the critical taper, so this does not have to happen).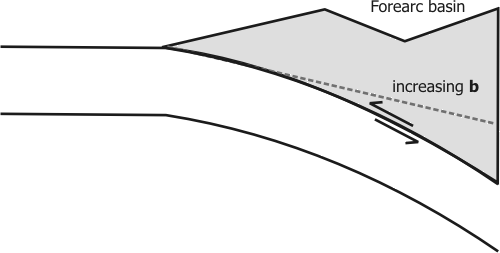
Further modelling shows that if this basin was then filled with sediment, the taper of the wedge would be increased a long way above critical. This allows larger strains to build up on the subduction thrust, because there is no possibility that any deformation can be accommodated in the wedge. This neatly explains why subduction zones with well developed forearc basins show a higher degree of seismic coupling.
I really like the way that the authors have taken a simple model, which I learnt about as an undergrad, applied it to a more realistic situation, and used it to explain some aspects of subduction zones in a new way.
[1] Fuller, C.W, et al. (2006). Geology 34(2), p 65-68.
21 February, 2006
Creationism on the march
When I discussed last month’s BBC poll which showed worryingly high levels of support for ID and creationism, I argued that some ambiguities in the questioning may have exaggerated the problem. It’s rare for me to suffer from excessive optimism, but this report in today’s Guardian does not make happy reading.
A growing number of science students on British campuses and in sixth form colleges are challenging the theory of evolution and arguing that Darwin was wrong.
The article cites medical students at Guy’s Hospital in London distributing anti-evolution leaflets as part of Islam Awareness Week; reports from an unnamed campus of students being failed for presenting creationist accounts as fact in their exam scripts; and the following testimony:
Most of the next generation of medical and science students could well be creationists, according to a biology teacher at a leading London sixth-form college. "The vast majority of my students now believe in creationism," she said, "and these are thinking young people who are able and articulate and not at the dim end at all."
It’s true that these are isolated incidents. But it is a worrying pattern, particularly because these stories are all about medicine and science students, who should have had more exposure to biology than most. Muslim or Christian, the fundamentalist notion that faith cannot be reconciled with the findings of science is apparently becoming increasingly pernicious.
The Royal Society is worried enough about all of this that it has invited Steve Jones (geneticist and author of a number of popular science books) to give a public lecture in April entitled Why Creationism is Wrong (details here). I’m finding myself quite tempted to go along.
19 February, 2006
Just call me Dr. Chris....
Well, I passed my viva with minor corrections, which is about the best outcome that you can hope for in these things: the examiners had no real problems with the science in my thesis, so all I need to do is tweak some figures, a few sentences here and there, and correct some typos. I then resubmit this new version and, after approval by my examiners and rubber-stamping by the University Senate, I will officially hold a PhD.
The examination itself was fine, on the whole. Because that was his area of expertise, and because I've proposed some...interesting...reinterpretations of New Zealand geology, the external examiner left the tough questions for the tectonics stuff - questions which I had ready answers to six months ago but had migrated to some of the deeper recesses of my memory in the interim, requiring me to stall and sound intelligent until they found their way back into the light. The most nerve-wracking bit was when I got sent out of the room for 5 minutes at the end, before they called me back in to give their decision. I'd held it together up until that point, but as the adrenalin started to wear off I started to feel a little bit shaky.
Oddly, although it is obviously a relief that I passed, my pleasure is surprisingly muted. Of course, I'm happy that the examiners thought my work was sound: but I think that a lot of me feels that the real test is yet to come. Will my published papers (and the ones to come) be noticed? Will the thinking of other scientists in the field be influenced at all by my ideas? I think that it is only when I see these things that I will consider my PhD to have been a success. Take your pick as to whether that attitude is either ludicrously perfectionist, or annoyingly egotistical.
16 February, 2006
Viva day approaches…
My first post to this blog way back in September coincided with the submission of my PhD thesis. After four years of toil, all that remained between me and doctordom was the oral exam. Cut to five months later, and that day is upon me. Tomorrow, I finally get my viva.
It is a source of some annoyance to me that it has taken 5 months to get to this point. This delay has principally been due to my supervisor not sorting out an external examiner for me: partly because he was being extremely picky, partly because he’s been too busy doing management stuff to chase up people, and partly (if you’re a cynic) because it’s been quite convenient for him to keep me in limbo career-wise so I stay here and run his lab for him.
To those unfamiliar with the whole process, the viva is a sort of ‘peer review’ of your thesis. People with expertise in your field get the chance to question you about your work, before deciding whether you have made a sufficiently novel contribution to science to qualify as a PhD. The format varies in different countries, but here in the UK it’s a closed session with you and at least two examiners, one from your department and an expert in your field brought in from elsewhere.
So, all those months of field work, those long sessions in the lab, motivational crises, tussles with recalcitrant equipment, struggles to make sense of strange data, and attacks of writer’s block… and the question of whether it was all worth it comes down a few hours with two guys in a room. Well, three in fact, because my supervisor wants to sit in. I have the right to say no, but it seems more hassle than it’s worth. I just hope that there isn’t a problem he’s not telling me about.
It should be OK, for a certain value of OK. I’ve produced a whole load of new data, and have used it to solve (or at least propose solutions to) geological problems far beyond the original remit of my thesis. Three of my chapters have already been published as papers. So whilst they will probably ask me tough questions, I should be able to successfully defend my work.
But… you can fail. Or get told that you only qualify for a lesser MPhil. Or get told that major corrections are needed. No matter how I rationalise it, there is a little bit of doubt gnawing away at me. There’s also the fact that it’s been 5 months, and things are not as fresh in my mind as they could be. I’d better stop blogging – and get reading.
14 February, 2006
The Art of Palaeomagic
Some of you may be curious about what I’m referring to when I list ‘Palaeomagic’ under my Specialist Subjects on the left. Even if you’re not, I’m going to explain it to you anyway. Palaeomagic is the in-house nickname for the field of palaeomagnetism, or paleomagnetism (as a concession to our American friends – just another example of their dodgy spelling), a discipline with which I have become rather familiar during the course of my PhD.
Palaeomagnetism, literally ‘ancient magnetism’, is the study of the signals left in volcanic and sedimentary rocks by the Earth’s magnetic field; signals which can be preserved over millions of years of geological time. On a broad scale, the geomagnetic field closely approximates a dipole centred near the axis of rotation.
The shape of this field should look familiar to most people: it resembles that of a giant bar magnet. This does not mean that the geomagnetic field is caused by a giant bar magnet at the Earth’s core; in fact the ultimate source is thought to be convection of liquid iron in the outer core (this is a subject worthy of its own post, which I may supply in due course). A compass needle will align with the field lines in the figure above, which curve from the south to north pole (due to the way magnetic polarities were first defined, the current magnetic north pole is currently located near the geographic south pole). This curvature means that although a compass needle will always align north-south in the horizontal plane, which is why compasses are useful for navigation, in the vertical plane there is a variation in the inclination (or dip) of the magnetic vector with latitude, from being horizontal at the equator to vertical at the poles. Also, a compass needle will point downward in the northern hemisphere, and upward in the southern hemisphere. Measuring the direction of the magnetic vector gives us information about where we are on the Earth’s surface, which will become important later.
The “palaeo” in palaeomagnetism comes from the influence the geomagnetic field has on ferromagnetic minerals, which can record the direction of an applied magnetic field even after it has been removed, as rocks are forming. In igneous rocks, minerals such as magnetite crystallise directly out of the lava as it cools. Below a certain temperature (~600oC) magnetite becomes ferromagnetic, and the crystals become magnetized parallel to the direction of the geomagnetic field. In sedimentary rocks, ferrmagnetic minerals tend to align with the geomagnetic field as they settle, and preserve this orientation as they are compacted and lithified. In both types of rocks, this alignment can be preserved as a remanent magnetization over millions of years of geological time.
The essence of palaeomagnetism is the measurement of these remanent magnetisations. Why bother? Because the magnetisation directions measured, in rocks of different ages at the same location, change over time. This information is useful in several ways, including:
Because geomagnetic reversals are global events, rocks of a similar age will record the same sequence of reversals, allowing the correlation and dating of rock sequences worldwide. This is the basis of the geomagnetic polarity timescale
I hope to explore some of these applications in more detail in future posts. For now, one question remains to be answered: why “palaeomagic”? Well, it does almost seem like magic sometimes: you can’t see a remanent magnetisation, you can’t feel it or smell it, and it is often a property of only a tiny fraction of the mineral grains in your sample. Also, the post above sketches over the details of exactly how you measure a remanent magnetisation. When I started my PhD, a study of tectonic rotations in New Zealand, I viewed palaeomagnetism as a simple tool: stick rocks in, get direction out. It turns out its not that easy. Some rocks guard their magnetic secrets jealously, behind a wall of present day overprints and remagnetisations; it requires a lot of work and head-scratching to coax any useful information out. To illustrate, I’ll note that on submission three and a half chapters of my PhD thesis were devoted to unravelling the remanent magnetisation of New Zealand sediments. Only then could I actually start talking about the tectonic story, which was what I was actually interested in. Without knowing the palaeomagnetic story, however, there was no coherent tectonic story; it was palaeomagic which transformed confusion into understanding.
07 February, 2006
A pox on IE
I'm away this week in Ireland, and borrowed a friend's computer to upload the last post. Being an enlightened Opera and Firefox user, it's the first time I've ever seen my new layout with IE; imagine my horror when I discovered the sidebar parked in the middle of the page, overwriting my post! Damn Microsoft and their buggy CSS implementation! Anyway, I've done a crash fix which appears to work on all three browsers... hopefully it will suffice until I can properly sort out what went awry.
06 February, 2006
Must try harder
The last few days have been a little depressing. I spent the week wearing my academic hat, marking the exams for the courses I taught last autumn, and it has been a thoroughly dispiriting experience.
Because they were – almost uniformly – awful.
That’s not a statement I make lightly; I just can’t think of anything good to say about them. In both of the courses I taught, it wasn’t just the factual errors that I had to contend with, but also the apparent inability of many of the students to actually express their thoughts in a coherent manner. For the essay questions, I was expecting something with an introduction, a presentation of relevant material, and a conclusion.
What I got in many cases was a haphazard scatter of (often wrong) statements, barely linked to those that preceded and followed it, and which if I was lucky had some relevance to the question that was being asked.
This situation has been preying on my mind, as I wonder how much of the blame for the students’ poor performance rests with me. In the past I’ve chuckled along with everyone else at the lists of student howlers which often accompany the release of the GCSE and A-Level results; but it’s not quite so funny when the students almost heroically getting the wrong end of the stick are ones that you’ve taught the stuff to. In my inexperience, was I so dire, so incoherent, that no-one learnt anything from my lectures?
I can’t deny the possibility that I may have been a contributing factor to the low level of understanding apparent in the answers. But can I be blamed for the laziness, the sheer lack of ambition, apparent in the essays? Perhaps I can. The lectures went little beyond a recital of basic facts and concepts, with very little referral to current research. Particularly for the third- and fourth-year course, is that not a lack of ambition? The lecture handouts were print-outs of Powerpoint slides. Is that not lazy?
In my defence, I inherited these lecture courses, Powerpoint presentations and all. I felt a little guilty at the time about how content-light they seemed to be, but I didn’t really have time to put much of a mark on them before I had to give them. I’m resolved, should I do any more lecturing, never to let that happen again. I must try harder.
But still. I wasn’t the sole lecturer on either course. Other, more experienced, people taught different bits, and set their own exam questions; the students didn’t have to answer mine. Yet they did. The questions I set weren’t difficult or obscure, and I wasn’t expecting knowledge outside of what was in the lectures; so even if I was appalling, at least some people should have been able to glean enough from the lecture notes and reading textbooks to get a decent mark. However much knowledge the students did (or didn’t) have, they should have at least been able to write about it in a clearer manner. Why didn’t they? I fear the answer might lie in one word: scaling. Bad marks make the department look bad, so the distribution of my marking will be shifted upwards. The adequate will become excellent. The awful will become merely poor. And the students will believe that the quality of their answers, and the level of their revision, was acceptable. What, then, motivates them to improve? From their perspective, they don’t need to.
Scaling is self-defeating. If we want the students to try harder, we have to make it clear that we won’t accept it if they don’t.
02 February, 2006
Annoying misconceptions in Geology
Scienceblogs has recently accumulated some of my favorite stops in the blogosphere into one convenient portal, and introduced me to a few more well worth reading, such as Uncertain Principles. A recent post (and growing comments thread) discusses irritating misconceptions in science. Maybe it's the fact that I'm marking exams at the moment and it's put me in a bad mood, but once I started, I couldn't stop thinking of geological examples. Here's my list, in no particular order of non-preference.
Tectonic plates move around on top of a sea of molten lava. Many people mistakenly believe that the beneath the Earth's crust lies a seething mass of molten lava, ready to erupt at any minute. Not true. As the figure below shows, although the temperature of a rock does increase with depth (as shown by the red line, the geotherm), so does its melting point due to the immense pressure exerted by tens of km of rock piled on top of it. 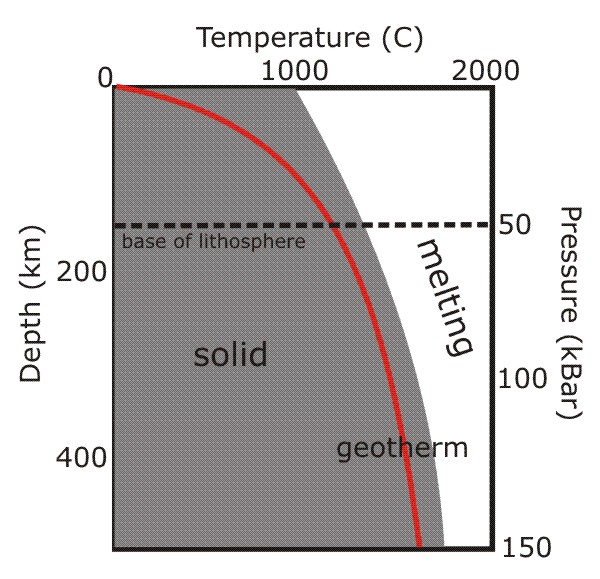
As you can see, at no point does the geotherm cross the solidus (the temperature at which melting would start), so the rocks remain solid even at great depths. However, below about 150-200km, the geotherm gets quite close to the melting point, which allows rocks to more easily deform and flow (a process known as creep). Think less molten lava, more Silly Putty. Mantle convection can therefore occur below this depth, even though the rocks are not melted. The more rigid, non convecting rocks above this boundary form the lithosphere, which forms the major part of tectonic plates (the crust is just a skin on top).
Melting to form magma, and hence volcanism, only occurs when something happens to disrupt this situation; three common ways that this happens are shown below. The geotherm can cross the solidus by being shifted upwards by rifting (which thins the lithosphere and allows upwelling of hotter mantle to shallower depths), or across by a mantle plume (an upwelling of hotter material from deeper within the Earth). The melting point of the mantle rocks can also be reduced by a change in composition; at subduction zones, this is caused by the addition of water from the downgoing plate.
This is the reason why volcanoes only occur in particular geological environments on the Earth's surface, rather than everywhere.
What earthquake and volcano 'prediction' actually means. Sorry folks, but it's never going to get to the stage where we can point to a particular volcano or fault and say, "this will erupt/rupture next Thursday at 11:00". For both volcanoes and faults, geologists can try and reconstruct the past history of eruptions and earthquakes, to see how regularly they happen. They can also watch for signs of imminent activity: the filling of a volcano's magma chamber might be accompanied by small earthquakes and ground uplift; the build-up of strain across a fault can be monitored by GPS. This gives some clues as the the liklihood of something happening, but it's just that - a probability, not a certainty. So the most precise forecast you're ever going to get is, "there's a high (or low) likilihood of rupture/eruption in the immediate future". And, particularly for earthquakes, "immediate future" could well mean "in the next decade or two"...
There is one 'geological column' for the whole Earth. The geological timescale divides the 4.5 billion years of earth history into distinct chunks, based on changes in environment or dominant forms of life over time. However, this does not mean that every rock of a particular age is the same. Just like today, in these periods many different processes were leaving their own unique record; marine deposits formed in shallow seas, deltas built out from coastlines, deserts formed vast dune fields. In other places, uplift of ancient mountain ranges led to no deposition, and erosion of rocks that had been laid down in earlier times. So there is no one geological column; each area has its own unique sequence of rock types, often with large time gaps in between different units. Correlating them all with each other is one of the major tasks of the geologist.
All radiometric dating is 'carbon dating'. This has cropped up in the exams I'm currently marking - I'm assuming (fervently hoping!) that it's not due to anything I said in the lectures, and it just reflects the generally held notion that all radiometric dating involves 14C. It's the isotope most people have heard of, because it is so widely used in archaeology. However, trying to 'carbon date' rocks is generally pointless; 14C has a half-life of 5,730 years, which means after about 50,000 years it has virtually all gone. Assuming there was anything to begin with, of course; there's not generally much carbon in volcanic rocks. This doesn't matter, because there's a whole array of different isotopes with half-lives much better suited to dating rocks tens of millions of years old.
Blowing up Earth-bound comets and asteroids at the last minute will save the day.. Nope, we'd still be doomed (OK, this is tenuous geologically, but it does annoy me).
A geologist can tell you the life story of a random pebble you've picked up on the beach. Don't get me wrong, pebbles can be useful - they tell you about local rock types along that section of coast, for one thing, which is very handy when you're mapping. Just don't be disappointed when the most information you get from me is 'sandstone'.
Well, that's the list so far...additions are welcomed.