31 July, 2006

A genuine quake prediction, or inspired guesswork?

Via geology.com news, I’ve come across an interesting article in Geotimes about a possible case of successful earthquake prediction:

For nearly three decades after Chinese officials predicted the powerful earthquake that hit Haicheng in the north of China on Feb. 4, 1975, details of their prediction process remained closely guarded. But now, after gaining access to formerly classified documents and key people involved with the process, a team of scientists has reconstructed this important event …

…In this month's issue of the Bulletin of the Seismological Society of America, however, Kelin Wang, a senior research scientist at the Geological Survey of Canada in British Columbia, and colleagues say the prediction was legitimate. The Haicheng earthquake is the "first, and so far only, case where a large earthquake was predicted," says Susan Hough, a seismologist with the U.S. Geological Survey in Pasadena, Calif.

Wang's team reviewed relevant documents and interviewed key witnesses in the prediction process to compile a detailed account of the events and decisions that led to the Haicheng prediction and evacuation. The team wrote that the prediction was "a blend of confusion, empirical analysis, intuitive judgment, and good luck."

The empirical analysis part involved the use of data collected about a series of large earthquakes which hit northern China in the 1960s. It appears that Chinese seismologists identified a number of tectonic events which preceded these earthquakes, which they then started to see again:
By June 1974, based on precursory anomalies that included a shift in land levels in the nearby Bohai Sea area, officials issued the first of two "middle-term" predictions that warned of an earthquake within one to two years.

So far, so scientific, but then we get into the intuition and luck:
No official "short-term" predictions — warning of an earthquake within a few months — were made, the team says, but some Chinese officials made "imminent" predictions, based on an increase in foreshock activity in the 24 hours before the main shock.

A large earthquake is usually not an isolated event, but occurs as the biggest ‘mainshock’ in a cluster of earthquakes in the same region. Aftershocks occur as the crust around the main fault rupture adjusts to the sudden displacement, and sometimes (not always) you get foreshocks as well – smaller earthquakes that precede the main event. The problem is that the foreshock-mainshock-aftershock subdivision is based only on the relative magnitude of the earthquakes in the sequence, and can thus only be applied restrospectively; if you show a seismologist the data from just one particular earthquake in isolation, they would not be able to tell you whether it was the foreshock to a larger event, the mainshock itself, or an aftershock. In Haicheng, it seems the officials saw increasing earthquake activity and decided it preceded a larger event, leading to their warning, but there was a lot of luck involved in this particular ‘prediction’. And it’s not clear whether it can entirely take the credit for drastically reducing the death toll anyway.
Although the imminent predictions correctly identified the quake's location, they did not specify a time, and they underestimated the quake's magnitude. Nonetheless, the predictions — along with some actions taken spontaneously by local citizens [due to education programs initiated after the 1960s quakes]— triggered warnings and evacuation orders around the area where the earthquake eventually occurred. According to the team, the evacuations, along with the durable style of housing construction in the area and the time of the main shock — 7:36 p.m., when most people were neither at work nor sleeping — saved thousands of lives.

Nonetheless, we see once again that the problem is not that there aren’t earthquake precursors (although some are more established than others), it’s reliably spotting them before the event, and understanding what (if anything) they are saying about its imminence.

27 July, 2006

Detecting extra-solar life

There's an interesting post at Dynamics of Cats about the difficult task of detecting the signature of life on extra-solar planets:


This is a hard question: for Earth-like carbon base, photosynthesising life on a low mass planet around a main sequence star, we think we have robust biosignatures - we want to see water vapour, oxygen (or ozone as a more easily detected proxy), carbon dioxide and methane.

However, as the post goes on to point out, early life on earth did not generate this signature, with significant atmospheric oxygen possibly only being present from about 1.5 billion years ago (which leaves a good 2-3 billion years with a different, and poorly constrained, atmospheric chemisty). And that's before you consider non-carbon based life.

The obvious limitation on detecting life outside the solar system is that spectroscopy is pretty much our only tool - the hope is that whatever life is out there will generate a 'weird' (out of equilibrium) atmosphere which we can actually detect. But astrobiologists don't need to look so far before they encounter problems. There's still some argument over the results of the Viking Lander experiments, for example (see here or here), not to mention the whole ALH84001 thing. In both cases the cautious consensus is that there is no conclusive evidence of Martian life, but sorting out life from non-life is clearly not trivial even when we can literally get our hands dirty in the search; no wonder trying to make the determination from light years away is 'hard'.

26 July, 2006

Lakes on Titan

Finally, what we've all been waiting for: possible evidence of liquid hydrocarbons on the surface of Titan:


According to the JPL press release linked to above, these images were taken by the Cassini radar in synthetic aperture mode, which means that the dark and light areas on the image correspond to smoother and rougher areas on the surface, respectively. The dark patches on these images are therefore quite smooth, as you'd expect if they represented liquid; their irregular shape is also quite suggestive. Each of these radar images covers and area of about 450 x 150 km, so if they are lakes they're fairly sizeable ones.

These images are from the north polar regions of Titan, which makes sense; it's colder there, so any methane and ethane would evaporate into the atmosphere less quickly. However, it's not completely clear to me why the scientists are so sure that these features represent currently filled lakes rather than dried up ones, as is the case on most of the surface we've studied so far. Perhaps the radar data indicate a particularly high value of smoothness for these features. Insider gossip from Emily Lakdawalla at the Planetary Society Blog indicates that this might be the case:


Cassini RADAR team member Rosaly Lopes [said that t]he lake-like features are "circular or kidney-shaped and very radar-dark -- the darkest things we have seen. Morphologically, they look much like lakes on Earth. There are drainage features around the sides of lakes."

The rest of the article has a very interesting discussion about the possible origin of the topographic lows that these features seem to represent. There's some evidence that they are collapse structures, so may represent cryovolcanic calderas. The evidence for that is presently fairly equivocal, but if that is the case then these would be the Titanian equivalent of lava lakes. How cool is that?

25 July, 2006

Graduation

As of yesterday, I am officially a Doctor. I have the certificate and everything.


I'm still shaking my head with amazement about that gown. As well as being a little confining on what was another very warm day, it makes me look like I'm a member of an ecclesiastical football team (by ironic coincidence, following semi-family tradition I vaguely support West Ham United). Those of you looking for the silly hat, fortunately we didn't have to wear that in the ceremony itself, although to keep Mum happy I wore it for the official photo.

I was discussing the total ridiculousness of this attire with a friend at work today. As well as claiming that I'd got off lightly (I'm hard pressed to see how, mind), she proposed the highly plausible theory that it is just the Universities' way of putting us upstart graduands in our place. As she put it:


"It's like they're saying: you think you're so smart? We can still make you look ridiculous"

So, the final postscript to my PhD? Perhaps, but it left me a bit cold - who cares about a certificate when you have the thesis on your shelf? Curiously though, I found that all of the major events at the end of my tortuous academic journey - submission, viva, final submission - have turned out to be somewhat anticlimatic. I'm not sure why that is. I think part of me feels that despite passing my viva, and even despite having published a large chunk of the work I have done thus far, the verdict on my work is still out - I'll only start to feel happy when I see it being cited by other people. But perhaps part of it is also that like life, the journey - the process of doing a PhD - is more important than the actual destination. Although NERC would add that you still need to get there, within four years if you don't mind very much.

20 July, 2006

Discrimination!

I took a few days off at the end of my Spain trip to visit the Picos de Europa. It seems that they don’t want my sort around:


I’m not sure they need to worry so much – for a start, most of it is limestone, and not particularly fossiliferous limestone at that. Also, the scenery is good enough to pull even my attention away from my feet:


19 July, 2006

Latest earthquake in Java

Monday saw another tsunami hit Indonesia, triggered by an earthquake offshore. But what more can we say about this quake? We can immediately use our knowledge about earthquakes and plate tectonics to make some basic predictions:

The earthquake will probably be due to movement along a thrust fault, probably associated with the Sunda trench. Tsunamis are caused when vertical (up and down) motions of the ocean bottom associated with an earthquake displaces the water above, creating a large wave. Vertical motions occur on contractional (thrust) and extensional (normal) faults. Java is close to a convergent plate boundary, so the earthquake is most likely to be on a thrust fault associated with this subduction zone.

The epicentre will be shallow. In order to cause a tsunami, the fault rupture must have propogated up to the ocean bottom, suggesting that it initiated at a fairly shallow depth.

Here's the USGS moment tensor solution:


Lo and behold, a shallow thrust (6 km may not seem particularly shallow, but at a subduction zone you can get earthquakes down to several hundred km) close to the Sunda Trench. The beachball like focal mechanism shows a thrust, and is very similar to that for the Boxing Day 2004 Earthquake (see also my previous post on seismology in this region).

Thus we have simulataneously demonstrated both the power and the impotence of plate tectonics at present. The fulfilment of my predictions shows that this earthquake fits in well with our overall tectonic picture of the region, but it is only a retrospective understanding; on Sunday, there was no way of predicting that an earthquake of that particular size would occur in that particular location.

18 July, 2006

Energy review says nothing much

Oooh, the government must be afraid of me. Why else would they choose to wait until I was away to release their new, improved energy review? Get the full details here. I neither have the time or the inclination to wade in detail through its entire 218 pages, but I have done more than skim through the executive summary; and, in contrast to the OTT pro-nuclear rumblings being put about by certain people, it does at least have some semblance of balance. In fact, contrary to the ‘back with a vengeance’ rhetoric, I find it a bit wishy-washy and non-committal. For example, the heavily-leaked nuclear stuff: as has been widely expected, the review concludes we need to build some new nuclear power stations, but doesn’t seem anywhere to suggest how many it thinks we might need. This might be why:

It will be for the private sector to initiate, fund, construct and operate new nuclear plants and to cover the full cost of decommissioning and their full share of long-term waste management costs.

Nothing to do with us, high gas prices will mean the private sector will be queuing up, no public money needed, oh no! Whether you think more nuclear is a good idea or not, I think we can all agree that this at best disingenuous. Decommissioning and waste storage issues are also somewhat glossed over (although to be fair, this is no change from the last 60 years or so).

One pleasant surprise is that there’s a whole chapter devoted to distributed energy generation and CHP which is actually reasonably positive, highlighting the potential benefits (which I’ve discussed before) as well as discussing potential downsides (possible loss of economies of scale, problems with fully exploiting offshore wind and other renewable resources). In the end, however, there is a disappointing, but predictable, commitment to not very much at all in this area:
To understand its true long-term potential, and the challenges we face in getting there, we will commission a high-powered investigation of the potential of distributed energy as a long-term alternative or supplement to centralised generation, looking at the full range of scientific, technical, economic and behavioural issues.

In a similar way, domestic energy usage and transport are referred to, but not in a way that lends confidence that the government is going to provide much in the way of leadership in these important areas. Even the warm and pleasing tones about renewables obligations are slightly marred by the fact that whilst wind is mentioned a fair amount (116 times in all compared to 441 for nuclear) solar and tidal energy get hardly a mention (17 and 11 times respectively).

It’s hard (especially in the current heatwave) to get really mad about something so fundamentally unambitious. Climate Change Action summarises some disappointed reactions from the likes of the Sustainable Development Commission and the Tyndall centre (pdf).

Geo-porn blog shocker

Now here's something a little disturbing: my blog is first up in Google for the search term 'pictures of scantily clad women'

Don't believe me? See for yourself - this post is first up. I discovered this rather curious fact when looking through my blog referrals in Sitemeter; I somehow don't think that that particular visitor got what he was looking for. I can only assume that this turn of phrase is too subtle for all the real X-rated sites. How quaint I am.

Update: It appears that putting 'porn' into a post title also does wonders for your traffic too (at least by my meagre standards).

17 July, 2006

Back from Spain...again

Yes, it truly is a hard life. No sooner am I back from one trip to sunny Iberia, it seems, than I get sent off on another. This time I was out in the Cantabrians in Northern Spain, to get 2nd going on 3rd years started on their independent mapping. More specifically, we were letting them loose around the towns of Villamanin and La Pola de Gordon, just north of Leon.

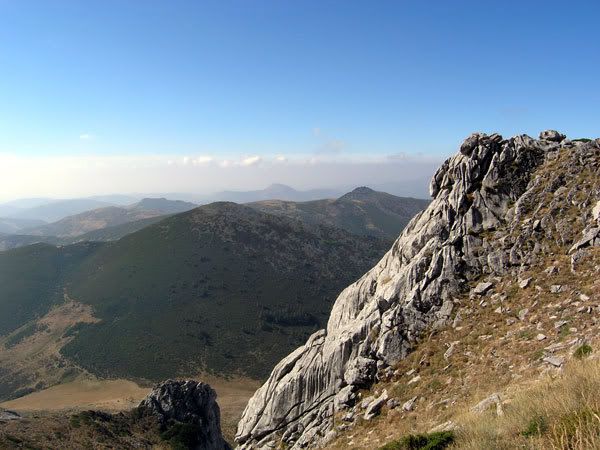
Back in my day (which doesn't feel that long ago, until I actually reflect on it and realise it was the end of the last millenium; several of the students are conspiring to make me feel old by having their 20th birthdays whilst out there) I got no such help, but given the complexity of the area, I don't begrudge the students some assistance. The rocks consist of a sequence of sandstones, limestones and shales, ranging in age from the Middle Cambrian (~550 million years ago) to the latest Carboniferous (~280 million years ago – here’s a timescale for your convenience), which were deformed mainly in the Variscan Orogeny (the uppermost units were actually deposited during or after this mountain building event). This has resulted in some quite complex geology. The picture below looks south from one of the highest points in the region:


The high ridges you see extending into the distance are pretty much made up of the same rock unit – the massive Barrios quartz sandstone. The fact that it keeps on appearing indicates the presence of many thrust faults which have caused the same sequence of rock units to repeat itself a number of times. Further to the south ridges of younger limestone also appear repeatedly. This photo is in fact taken across a massive fault: I’m standing on a Carboniferous limestone which is right next to the much older (Ordovician) Barrios, with most of the intervening units missing.

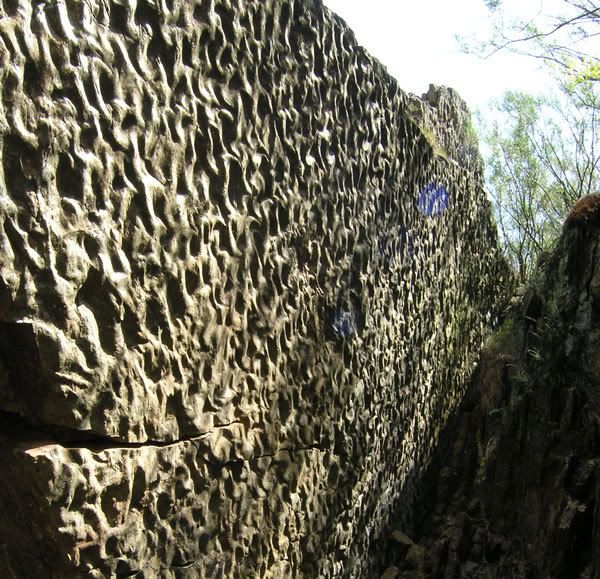
An additional wrinkle is illustrated by a second photo, which shows some very well preserved ripple marks preserved on the steeply-dipping bedding surface of a sandstone. You could find something similar on any beach today – but these ripples formed back before tetrapods were a twinkle in some ancient lobefins’ eye (if that makes no sense, have a read here or here).


But what’s puzzling here is that you’d expect to find these structures on the top surface of a bedding plane, and here they’re on the bottom. The deformation in this area has been so extreme that this bed has been overturned. In fact, in most places where sedimentary structures or burrows are found in this area, they indicate that the units are upside down. That’s some extreme deformation for you.

All of this gives our students plenty to mull over, and is why this region is a popular mapping area for many universities – in the last fortnight we met people from Imperial, Oxford and Dublin also wandering through the area. But given that the area is so sliced up by faults, it seems only fair to make sure the students know what the actual stratigraphic sequence is supposed to be (so they can spot missing and repeated sequences). We did this in a couple of induction days with the whole group, before some more individual tuition: pairs of students are mapping different, and separate, areas (for safety – they have to make their own observations and interpretations), and I went around with each of my groups individually around their area to make sure they had their eye in on the different units, and to check that they understood the process of mapping. It seemed that my efforts to provide some general clues on how to approach things were not entirely in vain - even before we left I saw some field slips with boundaries being drawn on, and many of the students I am supervising at least seemed to be asking the right sort of questions, even if their attempts to answer them were sometimes a little off-base. Of course, this year's lot may just be better than last year's, and it's nothing to do with me whatsoever, but I'll cling to the illusion that I was helping to make a difference. Of course, the real test comes when I see the finished results at the end of the summer...