



I dare you to visit this rather funky map quiz and not get addicted.
My only complaint is that the pictures containing nothing but ocean floor are a little bit too difficult...
(thanks to Ron).
Showing posts with label geology. Show all posts
Showing posts with label geology. Show all posts
13 February, 2007
How to waste even more time with Google Earth

12 February, 2007
Wasting your life, creationist style
I suppose as a geologist I should feel angry and aggrieved about this newly minted PhD student:
…Dr. Ross is hardly a conventional paleontologist. He is a “young earth creationist” — he believes that the Bible is a literally true account of the creation of the universe, and that the earth is at most 10,000 years old.
For him, Dr. Ross said, the methods and theories of paleontology are one “paradigm” for studying the past, and Scripture is another. In the paleontological paradigm, he said, the dates in his dissertation are entirely appropriate. The fact that as a young earth creationist he has a different view just means, he said, “that I am separating the different paradigms.”
Later in the article is becomes fairly clear that his motivation for getting his doctorate is to use “the fact that he has a Ph.D. from a legitimate science department as a springboard [for pushing a literalist viewpoint].”
I can’t bring myself to be angry about this, though (even though I can understand why others might). Instead, I find it sad; a waste of half a decade or more of someone’s life. Getting through a PhD is no picnic at the best of times; in my experience it’s only your fundamental enthusiasm and interest in your subject that gets you through. Forcing yourself through the whole traumatic process when you believe, deep down, that every word you write, every measurement you make, and every conclusion you draw is fundamentally mistaken – well, let’s just say that I can’t see it doing wonders for your mental well-being.
Over at PZ’s (where this story came to my attention - see also Chad's take), a large proportion of the comments are debating whether the University of Rhode Island would be justified in withdrawing his doctorate - or even, given that they knew about his young-earth beliefs before he applied, whether he should have been admitted to the PhD programme in the first place. I’d have to unequivocally answer no, and yes, respectively. In the context of a PhD you can only be judged on what you have submitted, and his supervisor tells us all we need to know:
His subject was the abundance and spread of mosasaurs, marine reptiles that, as he wrote, vanished at the end of the Cretaceous era about 65 million years ago. The work is “impeccable,” said David E. Fastovsky, a paleontologist and professor of geosciences at the university who was Dr. Ross’s dissertation adviser. “He was working within a strictly scientific framework, a conventional scientific framework.”
…
“We are not here to certify his religious beliefs,” he said. “All I can tell you is he came here and did science that was completely defensible.”
Presuming that this is an accurate representation of his dissertation, it’s a no-brainer: he came, he followed the rules, and he advanced his field: so he earned his doctorate, however galling it may be that he has proceeded to use his qualification in the manner that he has – to add a veneer of scientific authority to flawed creationist arguments.
Besides, there’s something else interesting about this story: the fact that when push came to shove, to get his qualification he had to follow the ground rules of science. And when he did that, what happened to all those big, obvious, gaping holes in the scientific picture of an old earth and common descent that we hear so much about? Did he try, even slightly, to cast some light on those holes with his research? It doesn’t look like it to me. Rather than a bold assault on the evil Darwinian empire, we get some meandering about “working within a particular paradigm of earth history”. Likewise, despite his self-declared mission to destroy Darwinism, it seems that Johnathan Wells kept his powder dry during his time at Berkeley. In both cases, the choice to use the PhD qualification as a rhetorical weapon, rather than the PhD research, pretty much tells you all you need to know.
10 February, 2007
Contestants, raise your hammers...
From the Berkeley Geological Association blog (with some snipping):
Geolympics is the ultimate in field geologist competition. This yearly event should put to the test all the field practices geologist's are trained to perform with accuracy and time contraints as parameters of success.
1) The Brunton: Imagine 5 or so rocks with varying strikes, dips, slickenlines, etc. that need measuring whilst being timed.
2) Rock Demolition: Imagine a line of geologists armed with a basketball size chunk of granite and their favorite rock hammer. They are timed to see who can smash their rocks into chunks no bigger than a baseball.
3) Twisted Map Folding: Imagine a new crisp map completly unfolded and a geologist blind folded who must then, by feel alone, fold the map into its original orientation while being timed.
4) Gear Up Gear Down: Imagine a geologist pulling up his/her truck when the clock starts and they must exit the vehicle and gear up with boots, hand lens, brunton, hammer with loop, acid bottle, map, rain gear, the works then when complete screaming ROCK IT! and then undressing again into street clothes, packing away the gear and firing up the truck again.
A few more potential events occur to me:
- Contact free running: A test of mapping skill and athleticism. Contestants have to precisely follow a contact between two formations, across hill, dale, ravine, cliff face, river, bracken, and bog. Points for speed, accuracy and style.
- Drilling time trial: One for the paleomagicians amongst us. Contestants are given an hour to drill, orient and extract as many core samples as they can. Scoring is based on the length of the cores as well as the number (i.e. an 8cm core which yields 3 standard paleomagnetic samples scores the same as three cores which yield only one each). Solo and pair events.
- Geo-orienteering: Like orienteering, except you have a geological map and specified rock samples must be gathered from each control point.
I'm sure you guys can come up with some more events...
06 February, 2007
Stalagmite records individual storms and intensities
In last months’ post about climate records from stalagmites and other speleothems, I concentrated on their potential for giving us detailed regional climate information over long time periods: 10s, and even 100s, of thousands of years. However, this article at Mongabay.com highlights some research concerned with records preserving climatic variations over much shorter timescales, and one of the more contentious issues in modern climate research: how the frequency and intensity of hurricanes is affected by our warming climate.
It seems that the towering storm clouds and humid atmosphere associated with hurricanes and other tropical cyclones produce rainwater which is extremely light isotopically (it has &delta18O 6 per mil more negative than normal precipitation), and a lot of it falls in a short time when a storm hits land. Amy Frappier and her colleagues decided to test if this pulse of storm water could affect the &delta18O of the groundwater enough to leave a signal in speleothems growing in underlying caves.
We used a computer-controlled dental drill to carefully mill off layers of powder from a fast-growing stalagmite [from Actun Tunichil Muknal caves, Belize], where each sample reflects cave drip water over periods of a week to a month. Analyzing these rock powders using standard techniques, we were able to detect brief spikes from recent hurricanes and tropical storms that produced rain over the cave - even when those storms struck only weeks apart!"
The effect is clearly illustrated by this figure from a paper Frappier et al. have just published in Geology [1]. Tropical cyclones which have hit Belize in the last 30 years (A) correlate well with short negative excursions in &delta18O (B). These excursions are superimposed on a longer-term pattern related to the El Nino Southern Oscillation (the 15 month offset with the El Nino record in C represents the time it takes rainwater to percolate from the surface to the cave). The accompanying carbon isotope record also shows the El Nino variation, probably due to changes in soil respiration rates, but not the storm events, showing that they are due to a separate forcing (heavy storm precipation).
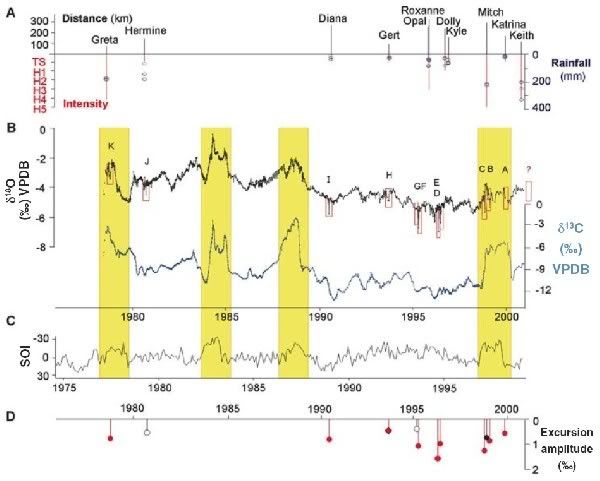
The final subfigure D is interesting, as it indicates that stronger storms (plotted in A) seem to produce larger excursions. Going back to the Mongabay piece:
"We also found that the relative size of spikes that we measured was related to the intensity of the storm, which is encouraging for the prospect of reconstructing the intensities of pre-historic landfalling storms.."
There’s currently a lot of debate over possible changes in storm numbers and/or intensity as a result of anthropogenic climate change (RealClimate has a good summary of the science) – some people claim there is already a clear signal, but others say that the historical data just isn’t good enough. Speleothem records can’t help resolve one of the major issues, the detection of non-landfalling storms, but it seems that they can potentially give us a much longer term record of trends in tropical cyclone intensity than is currently available; and a better idea of how much natural variability there was in the past can only help.
[1] Geology 35, p111-114 (doi).
This post was published on Day 2 of the Just Science challenge – a full week of science and only science. You can subscribe to the RSS feed at http://www.justscience.net/?feed=rss2.
All my posts for this week
05 February, 2007
Spot the planetary difference

There are many differences between Titan’s atmosphere and Earth’s, in terms of temperature (a couple of hundred degrees lower) and composition (no oxygen, more methane), but the cloud formation recently snapped above Titan’s north pole by Cassini, shown in the top image above, doesn’t look too dissimilar from storms snapped from our own planet’s orbit, as the lower image (source) illustrates. At 2400 km in diameter, it is quite a whopper - it would fill most of the North Atlantic.
It’s not that clouds haven’t been imaged on Titan before; we managed that even before Cassini arrived in Saturnian orbit, and Cassini itself has imaged some before now as well. But those previously observed cloud systems were mainly located around the south pole of Titan; what’s interesting about this one is that it is in the opposite hemisphere, directly above the lakes which have caused so much excitement. This makes it extremely tempting to link the two phenomena. The northern hemisphere of Titan is now entering its spring after a seven-year winter, so evaporation from these lakes in the rising temperatures could easily have contributed to the formation of clouds.
The key question, though, is what happens then: do significant amounts of hydrocarbons rain back out of the atmosphere to complete the “methanological cycle”? Is this precipitation intense enough be actively eroding out the landscapes imaged by the Huygens lander on its descent, and produce standing bodies of hydrocarbons in depressed topography? Or, rather than being refilled from above, are lakes on the surface more to do with hydrocarbon release from either subsurface “methanifers”, or cryovolcanic venting?
Some of these questions are still open. During Huygen’s descent, it measured variations in atmospheric methane concentration and temperature which, when examined in detail, indicated the presence of thin methane clouds capable of generating a persistent light drizzle [1]. Such weather makes the surface of Titan the natural location for any British extraterrestrial colony, but it is not really energetic enough to carve new drainage channels or any other new topography. And although attempts to model Titan’s atmosphere do suggest that strong storms can occur [2], how common or important they are in reality is unclear. Effectively, what we need is more observation time. Just like continuous observations of Mars over several years have revealed changing features which might indicate actively flowing water, if Cassini is able to observe Titan for long enough, we might not only see a few storms but also be able to assess their effect on the landscape.
[1] Tokano et al., 2006. Nature, 442, 432-435, [doi].
[2] Hueso and Sánchez-Lavega, 2006. Nature, 442, 428-431, [doi].
This post was published on Day 1 of the Just Science challenge – a full week of science and only science. You can subscribe to the RSS feed at http://www.justscience.net/?feed=rss2.
All my posts for this week

01 February, 2007
Lusi – the man-made mud volcano
The latest from Lusi
In May 2006, an exploratory gas well being drilled in eastern Java hit a limestone aquifer. Because the lower part of the well had not yet been ‘cased’ - sealed off from the surrounding rock - a surge of overpressured water was released into the mudstones higher in the borehole, fracturing them and mixing them into a hot mud which eventually made its way to the surface near the drilling rig.
Since then, since then, 7,000-150,000 cubic metres of mud* a day has been disgorged from a vent dubbed ‘Lusi’, burying surrounding villages. I found this video on You Tube showing the encroachment of the mud – a rising tide which shows no sign of stopping.
From a more elevated perspective, here’s a satellite image. I think those huts on the bottom left of the second panel are the ones you see at the end of the video

This is from a recent GSA Today paper by Davies et al.[doi], which confirmed that the drilling into the aquifer was probably responsible for the eruption; the company operating the well (understandably) tried to implicate an earthquake which occurred two days beforehand, but any seismogenic effects should have been immediate (and detectable as a pressure change in the borehole), and ‘liquefaction’ tends to affect less cohesive sands more than mud.
You can read more on this at PhysOrg. Then read how they’re planning to put a stop to it:
Indonesian geophysicists hope to stem the flow of a destructive mud volcano on East Java by dropping chains of concrete balls into its mouth…
… Last week, the government team tackling the disaster approved a plan that will use 1,000 steel chains to try to slow the flow of mud. Each chain is 1.5 metres long and links together four concrete balls — two that are 40 centimetres across and two that are 20 centimetres across. Each ball and chain set will weigh about 300 kilograms. The balls themselves will be modified to maximize their friction with the mud.
Apparently, they think this will restrict the flow without just causing it to divert somewhere else. I suppose it depends on how fractured the rock is, but I’d say it’s a long shot at best.
Update:And, a month later, this rather bizarre plan swings into action. On Saturday, they only managed to drop one chain because a steel cable on the hoisting mechanism broke. They managed sixteen more on Monday, but then they hit another potential snag when they looked at the telemetry from sensors attached to the chains, as another site has reported under the arresting title ‘Volcano consumes concrete balls’:
The balls slid one kilometre into the crater, roughly twice the depth anticipated, so many more than planned may be required to staunch the mudflow, said the operation's spokesperson Rudi Novrianto.
"Based on our monitoring of Monday's operations, we may later decide to add to the number of ball chains, but the decision will only be made once the initial target of 374 chains have been dropped into the mud hole," he said…
…Basuki Hadimuljono, the head of the team trying to plug the steaming crater, was quoted by the Koran Tempo newspaper as saying that the number of chains required may rise to 1 000 from the initial estimate of 374.
I remain unconvinced that this is going to work, but you can’t fault their perseverance.
(Thanks to Geology News for the heads-up which led to the update).
*In media units, that’s up to 40 olympic swimming pools.
25 January, 2007
Milankovitch goes solar?
From New Scientist:
Robert Ehrlich of George Mason University in Fairfax, Virginia, modelled the effect of temperature fluctuations in the sun's interior. According to the standard view, the temperature of the sun's core is held constant by the opposing pressures of gravity and nuclear fusion. However, Ehrlich believed that slight variations should be possible [due to instabilities caused by interactions with the Sun’s magnetic field]…
…Ehrlich's model shows that whilst most of these oscillations cancel each other out, some reinforce one another and become long-lived temperature variations. The favoured frequencies allow the sun's core temperature to oscillate around its average temperature of 13.6 million kelvin in cycles lasting either 100,000 or 41,000 years. Ehrlich says that random interactions within the sun's magnetic field could flip the fluctuations from one cycle length to the other.
These two timescales are instantly recognisable to anyone familiar with Earth's ice ages: for the past million years, ice ages have occurred roughly every 100,000 years. Before that, they occurred roughly every 41,000 years.
The paper is up on arXiv, and his model also has an oscillation in the 22,000 year range as well. This strikes me as a mighty big coincidence; it’s not like we’ve pulled the frequencies of variations in the Earth’s orbit - the Milankovitch cycles generally held to control long-term climate fluctuations - out of thin air. One thing I’d really like to know how sensitive the periods of these solar oscillations, if they exist, are to changes in the temperature structure of the sun, which I suspect we haven’t constrained with absolute precision. That said, a solar oscillation in the 100,000 year range might solve the problem of why it’s such a dominant signal in the climate record.
Anyone care to guess how long it will take for someone to claim this somehow has a bearing on the reality of anthropogenic climate change?
Update: Those of you who don't see the disconnect should head over to Open Mind for a clear explanation of why we think that the current short-term warning we're all worried about cannot be attributed to solar variability)
23 January, 2007
The writing in the cave walls
There’s a really nice post up on RealClimate about extracting climate records from stalagmites. Stalagmites and other speleothems form when water, percolating down from the surface and picking up dissolved carbon dioxide and other minerals on the way, penetrates into a cave system. When it reaches the cool, dry air of a cave, the carbon dioxide can escape from solution and carbonate minerals precipitate out. Take a steady drip of water, leave for a few thousand years, and voila:
The exciting part comes when we look at a cross-section through a stalagmite: just like tree rings, chemical changes in the different carbonate layers - particularly changes in the oxygen isotope values – reflect changes in the water falling on the land above the caves when that layer was deposited, and hence potentially give us high-resolution information about climatic variations over tens of thousands of years. Even better, you can determine the age of deposition using uranium-thorium dating; so what we potentially have is a source of climate records comparable to those we can get from ice cores (allowing us to independently check their chronologies), but globally distributed; you get caves on every continent, not just Antarctica and Greenland.
One thing this lets us look at is the variations in the strength of the monsoon through the last few glacial cycles. In the northern hemisphere summer, air rising above the warming land draws in moist air from the oceans to the south. The resulting rain is isotopically light (it has a negative &delta18O) because it has become fractionated by more evaporation and transport. A longer, wetter, stronger summer monsoon should therefore lead to lighter groundwater &delta18O than a shorter, drier, weaker, one; and that is exactly what we see in stalactites in the relevant regions. Here’s a record for most of the Holocene from Oman [1], showing both long term (over thousands of years) and short-term (over decadal and centennial timescales) variations in monsoon strength: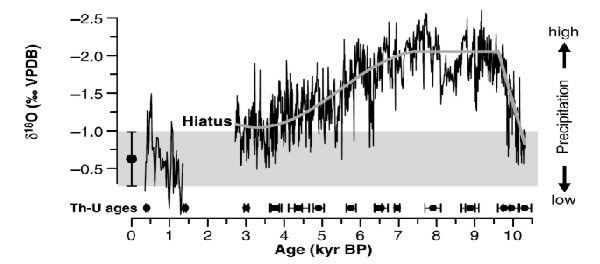
And here’s a longer term record, going back through a number of 21,000 year precessionary cycles, compiled from three overlapping stalagmite records from the Hulu Caves in China [2]. This second figure also plots the average summer insolation (black curve), and the Greenland ice core &delta18O (which tracks temperature – blue curve). The correlation is very good (especially if you look at a better version of the figure) – suggesting that the monsoon is stronger when it is warmer in Greenland. Centennial scale variations in Greenland have been linked to changes in the themohaline circulation, so these data give us some indication of the global effects such changes can have. 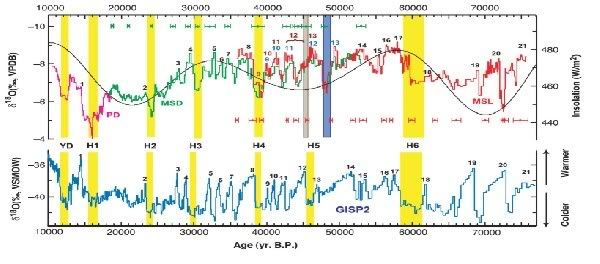
The variations in the monsoon being studied in these papers is a very strong climate signal, but as measurement and analytical methods get more sensitive and sophisticated (for example, the Hulu record has recently been extended back to 180,000 years ago [3]), tracking smaller regional variations in climate will become much easier. These results clearly show how, as this recent Science editorial [4] argues, “the age of the speleothem” could be upon us.
[1] Fleitmann et al., Science 300, 1737-1739 (2003)
[2] Wang et al/, Science 294, 2345-2348
[3] Hai Cheng et al., Geology 34, 217–220, 2006
[4] Henderson, Science 313, 620-622, 2006
14 January, 2007
Precambrian black smokers
These are pretty cool – some excellently preserved black smoker chimneys from a 1.43 billion year-old massive sulphide body in northern China:
Hydrothermal vents occur at mid-ocean ridges or volcanic hotspots: seawater, permeating down through cracks in the crust, comes into contact with hot rocks above the magma chamber, and reacts with them as they are heated to a couple of hundred degrees C - leaching out metals such as lead, copper, zinc and iron. These hot, buoyant fluids then return to the surface at vent sites, mix with sulphate-rich seawater and rapidly cool, leading to the precipitation of iron sulphides in chimney-like structures. Here’s a more typical view:
Individual vents are generally short-lived, and when the upwelling hot fluids inevitably migrate somewhere else, the fragile spires tend to collapse under their own weight. Massive sulphide bodies – valuable sources of metal ore - are built from the debris of many generations of collapsed smokers in a long-lived vent field. So it’s quite rare to see such well-preserved fragments. I just wish the authors had included some pictures of the things in situ.
Under the microscope, you can even see evidence of fossilised microbes: on the outside of the chimneys are stromatolite-like ‘microbialites’ – layered deposits of sulphides and organic carbon, sometimes containing mineralised filaments similar in morphology to bacteria found in and around modern vents.
Hydrothermal systems - where interesting chemistry is driven by geothermal energy – is considered to be one place on the early Earth where life could have perhaps arisen; those favouring such a scenario (which includes those hoping for extraterrestrial life in places like Europa) will be happy to see evidence of a flourishing ecology in such environments so long ago.
Source: Li and Kusky (2007), Gondwana Research, in press [doi]

06 January, 2007
Titanian shores
Details of the proposed polar lakes on Titan first announced in July, have been published in Nature by Stofan et al. (see also the accompanying News and Views article). The “lakes” are found in topographic depressions, and are thought to be filled with liquid based on their very low radar backscatter, which means whatever is in them is very smooth and reflective. This might seem counter-intuitive until you realise the radar beam is being sent towards to surface at an angle, rather than just straight down. A smooth surface therefore acts as a tilted mirror, reflecting energy away at the incident angle rather than back towards Cassini; a rough surface will contain parts with the correct orientation to return radar energy.
These features are by far the smoothest and most reflective found on Titan, and the contrast with the surrounding regions is quite sharp, as the figure below shows: the top row are false colour radar data with and without noise correction, and the bottom row are horizontal and vertical profiles of the normalised radar cross section (NCRS – a measure of the returned radar energy) along the white lines shown in b. -25 dB is about the level of instrument noise.
What’s also clear in the radar images is a very lake-like morphology, with irregular edges and what look like channels draining into the main body. The similarity is really brought home by this lovely image from the JPL press release:
It’s important to note that radar can’t tell us for sure that what we are seeing here are liquid hydrocarbons, although it does indicate a material with a low dielectric constant (i.e. it’s not a polar liquid, like water), as you’d expect. The authors also note:
Our inference that the northern-hemisphere lakes discovered by Cassini radar are at least partly liquid methane is consistent with various other considerations. If such lakes cover at least 0.2–4% of Titan's surface … they will buffer the atmospheric methane's relative humidity at its observed value, removing the requirement for a putative steady drizzle at the equator. If the abundance of lakes seen in [these] data are typical of their coverage poleward of about 70° in both hemispheres, then the fraction of Titan's surface covered by lakes is within this range. More recent polar radar data from Cassini support this assertion.
It is also unclear how these lakes are filled: is it by methane rain, or do the depressions cut into a subsurface methane aquifer? If the former, you would expect seasonal variations in how large and full the lakes are. Hopefully Cassini will keep collecting data long enough for us to observe, or rule out, such variations.
02 January, 2007
A geo-historical revolution
I’m actually in work today, despite the building being Officially Closed: you can still come in, but there’s no heating or canteen staff to provide coffee. However, an opportunity to engage in some warming ROFL’ing is provided by Adamant (via Pharyngula): a merging of the sequence of events in the geological record, scaled according to the biblically-based timescale of Archbishop Ussher, and human history. Here are some highlights which appeal to the paleogeographic nerd in me:
- 1384 B.C.: Shang Empire scraps compass research when China drifts over south magnetic pole.
- 1314 B.C.: On his way home from Troy ,Odysseus makes wrong turn into Tethys Ocean ;Homer writes it up.
- A.D. 1492: Panama's rise from sea thwarts Columbus's discovery of Japan.
- A.D. 1522: Sneak asteroid attack by Hernan Cortez smashes Aztec Empire
- A.D. 1588: Spanish Armada frustrated by continuing absence of English Channel.
Of course, the Young Earth Creationists think that most geology was confined to the year of Noah’s Flood, so this parody suffers from being rather less ridiculous than the ideas it is parodying.
07 December, 2006
Hold your Martian horses
I share Emily’s slight disquiet over the spin applied to the latest (and possibly last) results from Mars Global Surveyer. This is not to say that pictures like this (source) don’t get me very excited:

However, let’s be clear on what we can say for sure. The deposit which appears in the later photo on the top right, and is magnified in the bottom right image, has features very suggestive of fluid-like flow: it appears to be diverted around elevated topography, and fans out at the end. And we strongly suspect that any water on Mars will have very high concentrations of mineral salts, meaning that the lighter colour of the new feature might plausibly be explained by these salts being left behind on the surface when flowing water sublimes away in Mars’s puny atmosphere. However, in the absence of spectrometry to analyse the composition, there are still alternatives to water, such as liquid carbon dioxide, or dust flows.
In the midst of all this excitement I wondered whether there was any more data coming in from MARSIS, the radar instrument on Mars Express. It’s been more than a year since I blogged about preliminary indications of subsurface water ice beneath Chryse Planitia (at mid-latitudes, like the crater gulleys being scrutinised by NASA). Very little seems to have been released since; the only reference I found was a throwaway remark in this nice summary article:
"MARSIS has shown that many of the upper layers of Mars contain water ice," says Jeffrey Plaut of the Jet Propulsion Laboratory, Pasadena, who is the co-Principal Investigator on the MARSIS experiment.
Interestingly, most of the article is discussing spectrometry results which show how early standing water on Mars seems to have been fairly quickly locked away in clay minerals, sulphates, and red ferric oxides. But pure water may still be around, in the form of subsurface permafrost which in some places may be quite close to the surface. The Global Surveyor pictures hint that this arrangement may not be completely stable. And dynamic processes, even on a small scale, are exciting; change leads to disturbances from equilibrium, and interesting chemistry, which are the sorts of things that life thrives on.
Either way, results like this show exactly how the decision to send a succession of probes to Mars to place it under close, continuous observation is paying real scientific dividends.
06 December, 2006
Spotting geologists in the wild
Here is a good place to start for pointers (although the socks+sandals thing is a lie perpetuated by people jealous of the ease with which we get other people to pay us to go on holiday):
Geologists are 'scientists' with an unnatural obsession with rocks and alcohol. Often too smart to do boring monotonous sciences like chemistry or physics, geologists devote their time to mud-worrying, volcano spotting and high-risk colouring in.Follow the link to the Uncyclopedia, Wikipedia's "very special" cousin, for more. It seems that they recognise the importance of us Geologists in the scientific ecosystem, because as yet only the Physicists have had similar treatment (well, Geographers have too, but we all know that they're wannabes).
One of the main difficulties in communicating with geologists is their belief that a million years is a short amount of time. Consequently, such abstract concepts as "Tuesday Morning" and Lunchtime are completely beyond their comprehension.
To spot a geologist in the wild, look for:
- Socks worn with sandals, unless the wearer is German.
- Hand-lens, compass, pen-knife, handcuffs etc. tied round neck with string.
- Ownership of a pet rock (in the case of palaeontologists, this will be their closest friend).
- Overenthusiasm on the subject of dinosaurs.
- Someone explaining to airport security that a rock hammer isn't really a weapon.
- Takes photos, includes people only for scale, and has more pictures of rock hammer and lens cap than of his family.
- Someone with collection of beer cans/bottles rivals the size of his rock collection.
- Someone who brings beer instead of water when hiking.
- Someone with unnatural amounts of facial hair and wears lots of polar fleece.
- Someone whose lunch consists of rocks, instead of ordinary bread.
- Someone who consumes tonsil-killing chili for dinner every night of the week, and warms it up in a can on the drill rig engine block.
- Often has hair in a pony-tail (this applies to male or female geologists).
- Someone who considers a "recent event" to be anything that has happened in the last hundred thousand years.
- Someone who licks and/or scratches & sniffs rocks.
- Someone who eats dirt and claims to be "getting an estimate of grain size"
25 November, 2006
Return of the Megatsunami
Update: Further developments in this story can be found here.
It seems like megatsunamis are back in vogue, but this time a different culprit is in the frame. Around the turn of the millennium a lot of publicity was given to the suggestion that a 200 cubic kilometre-sized chunk of the western flank of Cumbre Vieja, an active volcano on La Palma in the Canary Islands, was poised to fall into the sea in a future eruption. Modelling suggested such a collapse would send a gigantic tsunami racing westward across the Atlantic, and the eastern seaboard of the US would be assaulted by 50 m high waves that would penetrate up to 20 km inland (for comparison, the Boxing Day 2004 tsunami produced waves 20-30 m high which penetrated 2-3 km inland on the Sumatran coast, a mere 160 km away from the epicentre).
This apocalyptic scenario was put forward by Bill McGuire and his colleagues at the Benfield Hazard Research Centre. McGuire has become the go-to guy when you want a geological scare-quote for your breathless documentary about how we’re all doomed, whether by megatsunami, supervolcano, or some other hyperbolically titled geological phenomenon. Here in Southampton, some people who have studied past collapse events in the Canaries think that the risk is being a tad…overhyped (see also here for the Benfield team’s counterargument, because you seem to get a series of much smaller landslides rather than one big one which will wipe out the whole of Western Civilisation.
Now Phil calls our attention to an article in the New York Times (free registration required) which highlights another potential source for really big waves - oceanic asteroid impacts, which a group of scientists led by Dallas Abbott have proposed as the source of some interesting wedge-shaped deposits, referred to as ‘chevrons’, you find on some shorelines, particularly around the Indian Ocean. Firing up Google Earth, we can find them on the West Australian coast (the line on this and the following images is 5 km long:
and here are the stars of the NY Times article, in Fenabosy bay, Madagascar: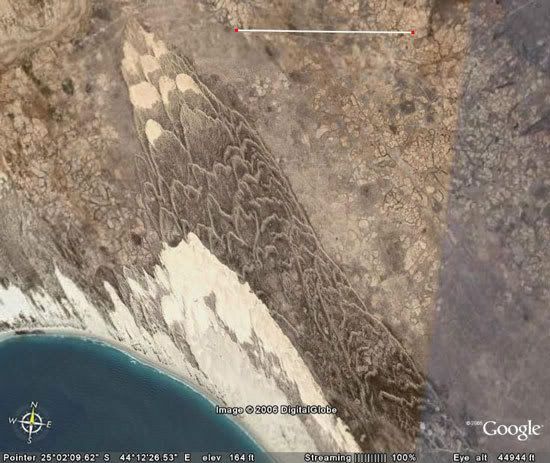
and some similar structures I’ve spotted on the east coast of South Africa:
From a distance the chevrons resemble large dunes, but when you look closer things don’t fit. Studies of the Australian chevrons (see here and here) reveal that although they’re largely made up of sand, they also contain shell debris and cobbles (clasts of rock about 10-20cm in diameter), and sometimes are associated with much larger boulders, which appear to have been transported a considerable distance.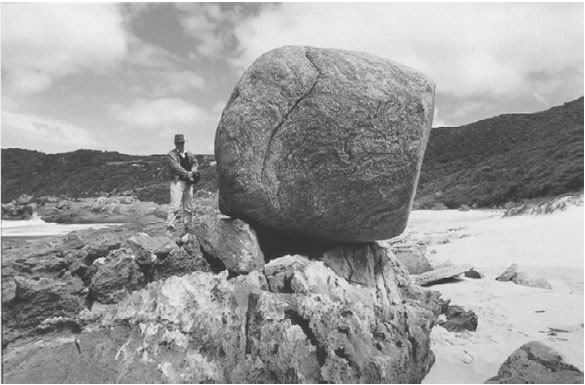
These observations are consistent with the chevrons being formed by a violent surge of water – a storm surge or a tsunami – sweeping the shells and other marine material inland. The strength of current required to transport the large boulders, and the distances inland (several km) and height above present sea level (10s of m) this material now crops out, have led some people to favour a tsunami origin.
So where do the asteroids come in? Look at this animation of the propagation of the Boxing Day 2004 tsunami (for those with lots of bandwidth, go here for the high resolution Quicktime version), and compare the wave directions radiating away from the Sunda Trench with the orientation of the chevrons found around the Indian Ocean. It’s clear that the former cannot cause the latter, so the chevron-causing tsunamis were not generated by subduction zone earthquakes (all of the other plate boundaries in the Indian Ocean are spreading ridges). Even if the orientation wasn’t wrong, the size of wave required to form structures on the scale of the chevrons dwarfs even the tsunami generated by the magnitude 9.2 earthquake two years ago.
Hence we need another source, and Abbott and the other members of the ‘Holocene Impact Working Group’ reckon that source is an asteroid impact, specifically the one which formed the 18-mile wide Burckle Crater, located in the centre of the Indian Ocean (31°S, 61°E). To support this hypothesis, they cite analysis of some of the marine fossils found in the Madagascar chevrons, which are fused with metallic flecks enriched with elements common in chondritic asteroids but rare in the Earth’s crust (as Lab Lemming explains rather better than the NY Times article).
This is not the only recent large impact Abbott and her colleagues have proposed – you can find chevrons on the eastern coast of Australia and southern New Zealand which they’ve linked to a crater on the New Zealand continental shelf. That’s at least two major impacts in the last 10,000 years, which is a bit at odds with the current estimated frequency calculated from astronomical surveys of near-earth asteroids.
In the midst of this contradiction, then, it is worth noting that the evidence is still slightly ambiguous. From the information I can find online there is reasonable evidence that at least some of the chevrons are caused by tsunamis, but the orientation of many of the Australian chevrons seems a little too north-south to be obviously traced back to Burckle Crater, which is almost directly to the east; and in the second of the two papers I linked to above, carbon dating of coral and shell debris in the chevrons suggests that together they record at least three events, roughly 700, 2000 and 6000 years ago - Burckle Crater is thought to be about 5000 years old - rather than one big event, although this may be complicated by reworking of older debris. Perhaps, then, we are looking at evidence for a number of smaller impacts, perhaps mixed in with submarine landslides, rather than a single big one forming all the chevrons. Such an interpretation would probably be more consistent with the astronomical data – there’s probably more uncertainty in impact rates of smaller asteroids, as they’re harder to spot (while we’re on that subject, it seems that estimates of the size of tsunami generated by an impact of a given size vary widely, which introduces additional uncertainties) . However, only time, and some careful dating work, will tell.

13 November, 2006
Earth – dwarf planet
I’m somewhat chagrined than I didn’t pick up on this myself, but I’m amazed that no-one else did: in all the furore over whether Pluto was a planet or merely a borrowed geological term, no-one stopped to think of the nominative consequences for our own fair sphere. Anjana Ahuja reports in The Times on the views of the editor of Sky and Telescope magazine, Richard Fienberg:
According to the IAU’s General Assembly, which met in Prague this year, a celestial body can be called a planet only if a) it is in orbit around the Sun; b) it is round (in other words, is massive enough to be shaped into a ball by its own gravity); and c) it has cleared the neighbourhood around its own orbit.
It is c) that has proved awkward. The IAU meant that planets should orbit the Sun in isolation, rather than whizzing around with other bodies, such as asteroids. This clause did for Pluto, because it resides in the Kuiper Belt, a girdle of icy bodies that lies beyond Neptune.
But, Fienberg points out: “Our own world is threatened by . . . a host of other near-Earth asteroids whose paths around the Sun intersect ours. By strict application of the IAU’s new rules, this means Earth is no longer a planet either. Ditto for Mars, Jupiter and Neptune, all of which are accompanied in orbit by little asteroids. Ridiculous!”
Special plead your way out of that one, IAU. I confidently predict the appearance of a modified sub-clause which defines 'cleared' as 'not having any other bodies above a certain percentage of the size of the candidate planet' – if there isn’t one already. It’s not so much I’m convinced by this argument, but it just shows how easy it is to tie yourself in knots when you start preferring semantics to science. And this closing line is priceless:
Fienberg has come up with a fresh mnemonic, forged in pure bitterness, to describe the new Pluto-less planetary octet: Many Very Egotistical Malcontents Just Screwed Up Nomenclature.
09 November, 2006
Nuclear seismology
A barely remembered anecdote, the recent talk of detecting nuclear explosions, and a Web of Knowledge search combined to bring this paper up on my screen:
Seismic tomographic inversion of Russian PNE data along profile Kraton [1]
The acronym ‘PNE’ is made more explicit in the next result:
Origin of upper-mantle seismic scattering – evidence from Russian peaceful nuclear explosion data [2]
That’s right – PNE stands for ‘peaceful nuclear explosion’, a phrase from a simpler time when people seriously advocated using nuclear explosives to dam rivers, create new anchorages, and release gas from underground reservoirs (which, shockingly, turned out to be radioactive). Both the USA and USSR engaged in this interesting pastime, but the Soviets detonated 239 PNEs against the Americans’ 28, a disparity that is probably due more to the relative power of each country’s citizenry (I suspect even in those days. if given the choice very few people would fancy a close-up view of mushroom clouds) than a difference in official enthusiasm.
Anyway, it seems some Russian geologists had the bright idea of using PNEs to undertake controlled source, wide-angle seismology on a scale not achieved before or since. They arranged to have a series of nuclear explosions set off along a number of lines (with names like 'Quartz' and 'Kraton') stretching several thousand kilometres across the USSR, along which they also deployed seismometers. Unlike reflection seismology, where only the reflected seismic energy coming directly upwards from buried discontinuities such as boundaries and faults is collected, wide-angle seismology deploys seismometers a long way from the source in order to pick up refracted seismic energy; because the speed of sound generally increases with greater depth (and pressure) in the Earth, due to Snell’s Law of Refraction downward-travelling waves eventually curve back upwards towards the surface. If you get far enough from the source, not only will a seismometer pick up these deep-diving waves when they reach the surface, but because of their higher average speed these waves will actually reach that seismometer before ones that have travelled at shallower depths. The distance from the source at which the ‘first arrivals’ from different depths first appear provides a great deal of information about the velocity structure, and hence the physical structure, of the subsurface rocks along the survey line (simply put, earlier appearance of deep waves=faster velocities – although obviously it’s a bit more complicated than that, especially when you factor in the presences of sharp discontinuities in wave-speed across lithological boundaries).
Methodology wise, there is quite a large overlap between these wide-angle techniques and earthquake seismology. However, because the source in this case is man-made, you minimize some of the major uncertainties which limit resolution when your source is a natural earthquake: the exact time and location that the source wave was generated, and the nature of the original signal (as I’ve discussed in the context of the North Korean test, man-made seismic signals are generally much shorter and simpler than an earthquake signal). The frequency of the signal is generally higher, too, which also improves resolution. There is however, one major drawback: the airguns (or less commonly nowadays, conventional explosives) used in seismic experiments produce orders of magnitude less energy than an earthquake does, meaning that pretty much all of the waves penetrating below the crust-mantle boundary (Moho) –about 35-40 km below the surface in normal continental crust - dissipate before they can get back up to the surface. The figure below shows the inferred paths of seismic waves picked up along a wide-angle survey line in the Aleutian Islands (the source is located in the centre, the scales are in km) [3].
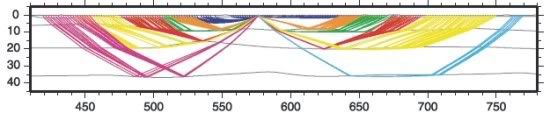
Whatever your feelings about the rationality of using nuclear bombs in this way, you can’t deny that they’re going to generate a hell of a lot more energy, allowing signals from deep in the mantle to be received back at the surface. Here’s a similar figure for the ‘Kraton’ PNE seismic line (from [1]. Note the change in horizontal as well as vertical scale: whereas seismometers 2500 km away from the source are fairly pointless for normal wide-angle surveys, for a PNE shot this is about the point that first arrivals from the 660 km discontinuity start arriving. Which I can’t help being a little bit impressed by.
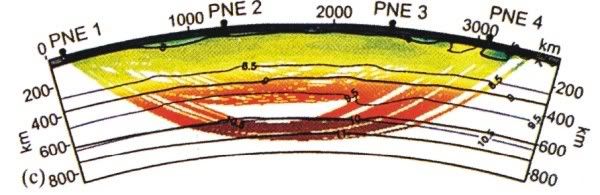
The second of the two papers I’ve cited concentrates on the uppermost mantle, 100-200 km beneath the Earth’s surface. The waves travelling through this region appear to be travelling slower than in the overlying rock, and are also being scattered a lot, resulting in noisy first-arrivals data (the relationship between the arrival time and the distance from the explosion is not linear). The authors propose that this is because the mantle at this depth is partially molten. It seems that the unique data generated by these 30-40 year-old experiments is still reaping dividends, now that scientists worldwide can access them and apply the latest processing tricks.
References
[1] L Neilson et al., Geophysical Research Letters 26(22), p 3413-16, 1999.
[2] L. Neilson et al., Geophysical Journal International154, p 196-204, 2003.
[3] D Shillington et al., Geochemistry Geophysics Geosystems 5, Q10006, 2004 [doi]
02 November, 2006
THC not as weak as we thought (most of the time)
Following up from last month, the first results from the real-time monitoring of the thermohaline circulation were presented by Harry Bryden at the RAPID conference in Birmingham last week. I wasn’t there, so you should go to RealClimate and read Gavin’s analysis, as he was. This quote sums up the major news:
There were two key observations: first, that the approximations that had been used in the Bryden et al study were actually valid, and secondly, that the variations day by day varied by around 5 Sv (1 Sv is about 10 times the flow of the Amazon). The mean over the year for the MOC was 18 Sv.
It seems that over timescales of a few days there are fairly sizeable shifts in the amount of North Atlantic Deep Water (NADW) crossing the 25oN transect. These results pretty much destroy any hope of extracting any meaningful long-term trend from the existing data set of decadally spaced, one-time snapshots of the circulation; the ‘weakening’ from 23 to 15 Sv since 1957 proposed in Bryden et al.’s Nature paper last year is very close in magnitude to the observed natural variability (and their 2004 hydrographic section underestimated the average strength of the present circulation by 2 Sv). In an interview with the BBC, Bryden still seems fairly convinced there is some weakening of the circulation (by 10% in the last 25 years rather than 30%), but I think the jury’s out on even that at this stage.
I’m wondering whether Nature is going to follow up on the fact that one of their headline papers was a little premature (no luck so far...), but as Gavin points out, the media seem to have missed the down-sized estimate in their excitement over the curious 10 day period in November 2004 when the southwards flow of NADW was weak to non-existent (see here, for example). According to someone else I know who attended the talk, Harry Bryden ‘just dropped this in’, and it’s certainly not in his abstract. Why? Because at the moment no-one really has any idea how this could happen. To understand the confusion we need to look a little further north. NADW is principally formed by cold saline water sinking in the Norwegian Sea, but as the figures below shows, the route south is not simple, because it’s path is along the seabed is blocked by the Greenland-Scotland Ridge (GSR), part of the volcanic edifice which Iceland sits atop of. The top figure[1] shows how the GSR acts as a sort of dam, with three or four ‘sills’ at bathymetric lows acting as spillways which spilt the NADW into different currents. The bottom figure [2] shows how these currents all join back together at the southern end of Greenland and head south as one big water mass.
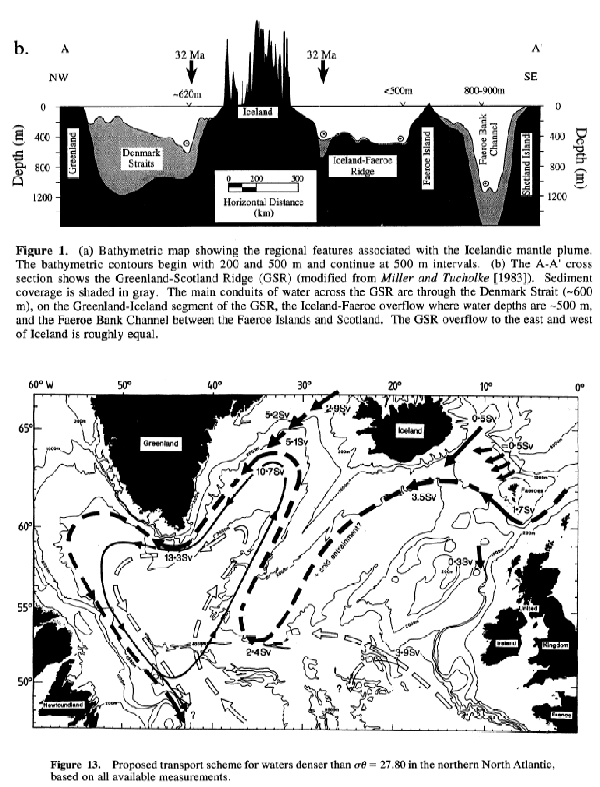
Why is this important? It means that the apparent shut down of the THC is not because there was a temporary hiatus in NADW production (due to, say, freshening of the surface waters due to particularly strong seasonal melting in the Artic). The different routes taken by the NADW over the GSR all take different times, so any cessation in downwelling would not simultaneously cut off all the currents coalescing south of Greenland. There will always be some water. So, if this is a real signal, the whole water mass seems to have somehow been held up in the northern Atlantic somewhere, which seems a little weird. We scientists like weird, or course, but at this stage we need more data: how often do these ‘mini-shutdowns’ happen? Are they seasonal/cyclical or random? I think much more interesting stuff is going to come out of this array over the next few years – not least a robust estimate of the longer term trends in the circulation.
Newer developments:
The Case of the THC "Shutdown"
[1] From Wright & Miller (1995), Paleoceanography 11(2), p157-170.
[2] From Dickson & Brown (1994), JGR 99(C6), p12319-41.
16 October, 2006
What caused the Hawaiian earthquake?
Far be it for me to refuse a request. In the comments to my last post:
I can't find an email address for you or a more appropriate place to post a question. I'm looking for someone, anyone, who has any ideas about the cause of Sunday's Hawaiian earthquake. I've posted the question on my blog at ElementList [where there is a very cool photo of a rockfall triggered by the quake]. The quake was very deep (~38 km) and was strike-slip. This seems like an odd place for that kind of quake. Any ideas?
This is an interesting one – I should warn that most of what follows will be speculation (informed speculation, perhaps…). First, lets have a look at the USGS moment tensor solution:

Note that the depth is now being reported as 28 km, which is deeper than a lot of the normal seismicity, but not unusually so. However, the size and the location of this earthquake are both unusual. For comparison, here’s a map of seismicity on the Big Island for the year 2000 (from the Hawaii Volcano Observatory).

As you can see, earthquakes are hardly rare on Hawaii; the emptying and filling of magma chambers, and molten rock moving to the surface, all produce stresses which result in earthquakes. However, they are pretty much all less than magnitude 4, more than 400 times less powerful than today’s 6.6. Also noteworthy is that a lot of the seismicity is concentrated underneath the volcanoes, as you would expect if it is associated with magma movement; in contrast, today’s quake and aftershocks, as shown in the figure below (source) were located off the NW coast of the Big Island.

All of this suggests that this earthquake is not associated with the volcanism. So what is the cause? Two possibilities spring to mind:
- The Hawaian islands are 5 km-high piles of basalt that represent a very large load on the oceanic crust and lithosphere beneath them, causing it to bend downwards around the bases of the seamounts. The earthquake could be releasing some of the stress building up as the islands continue to grow.
- Although most deformation on the Earth occurs at plate boundaries, some stresses are still transmitted to the interior of plates, where they cause intra-plate earthquakes at weak points. It could be that the crust around Hawaii is such a weak point. My first thought that this was an effect of the hotspot volcanism (lots of cracks for magma migration, etc.). But then another thought occurred. Here’s a bathymetric map of the Northern Pacific:

See those long, linear features? They’re oceanic fracture zones, the inactive parts of the transform faults which separate the spreading centres of mid-ocean ridges (these Pacific ones eventually join the East Pacific Rise just off the west coast of the Americas). And one of these fracture zones, the Molokai Fracture Zone (rather bizarrely abbreviated as OFZ in this particular image) just happens to intersect with the Hawaian Islands. It’s quite common for inter-plate earthquakes to occur on old faults, as they’re much weaker than surrounding rock, and the focal plane solution is consistent with an E-W trending structure.
So that’s my guess: this earthquake is accommodating large-scale, intra-plate strains in the Pacific plate (shifting up into really speculative, I’ll note the nice correlation to the ~NW absolute motion of the Pacific plate - see here for example), and may be due to reactivation of an old fracture zone, or a structure associated with it. More knowledgeable heads are free to weigh in and correct me...
[Update: Western Geologist has a good post up pointing out that there's a big difference between the USGS focal mechanism given above and the Havard CMT solution, the latter indicating an oblique extensional fault - more consistent with the quake being a response to plate loading - rather than strike slip and suggesting that the focal planes may not be well constrained. He's also dug out the locations and mechanisms of other large (non-volcanism related) quakes in the last 20 years, and discusses how they relate to this weeks'.]
12 October, 2006
Some updates
More info on the North Korean nuclear test (or ‘tesr’, as it was in my title for a couple of days): Jake points to CNN report that it was supposed to be a 4 kiloton device - that’s what the Chinese were told by North Korean officials before the test, anyway. If a 10-15 kT device generates a magnitude 5, magnitude 4.2 would represent a yield of 1.6-2.4 kT (very rough calculation – it’s a logarithmic scale, and the starting figure isn’t exactly precise), so it’s a little on the low side, indicating something didn’t go right (it’s not completely impossible that some bizarre combination of large cavity size and local geology led to very inefficient conversion into seismic waves, but that would be mighty convenient). Arms Control Wonk has some speculations on what - plutonium is much more tricky than uranium, it seems. Meanwhile, the Lab Lemming takes the time to debunk the hysteria over a possible second test (quite how a subduction zone earthquake off the Japanese coast got mixed up with a shallow explosion on the Korean Penisula is beyond me - when I first heard this rumour I just looked up the USGS map of recent activity - which clearly just shows Monday's event - and that was that).
Further to my rant about Truth in Science, I was glad to discover that there’s more than a few of us who aren’t going to let their false appeal to ‘balance’ fool anyone. The British Centre For Science Education have a whole section devoted to Truth in Science, and they’ve dug up some interesting facts about the clear creationist roots of the major players in this organisation as well as joining in the debunk-fest. Science, Just Science are also on the case, with a whole topic in their discussion forums. It’s nice to know I’m not the only one worrying about this; although we may not be quite as infected with the creationism meme over here, we don’t have that pesky separation of church and state thing either.
10 October, 2006
North Korean nuclear test
See also my update
Lab Lemming asks whether seismology can say anything useful regarding North Korea’s nuclear test. You’d certainly hope so, as monitoring of the Comprehensive Test Ban treaty relies upon it. An earthquake, where rock slides along a fault plane, generates both compressional (P) and shear (S) waves (but generally more of the latter), and patterns of compressional and dilational first motions in the P waves (which are the basis of the beach ball-like focal mechanisms I’ve discussed previously). Explosions basically just push the rock outwards in all directions, producing lots of P waves, not many S waves and a focal mechanism which looks like a big solid circle.
The USGS has confirmed that they detected a seismic event, magnitude 4.2 , which appears to correspond to the test, but they have yet to generate a focal solution (they don’t usually bother for events smaller than about magnitude 5, probably because the signal received at distant stations is too weak to reliably measure first motions). However, the Western Geologist has dug up some seismograph data from here, which I’m just going to lazily reproduce: the first graph is the North Korea event, the second is a recent earthquake for comparison (each line represents one station, which are different distances away, hence the time difference).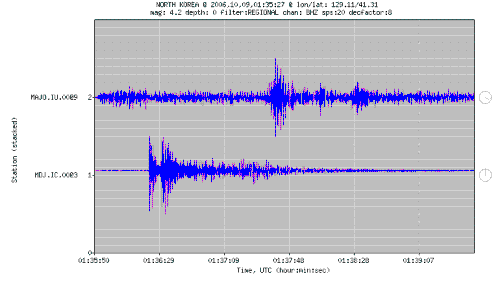
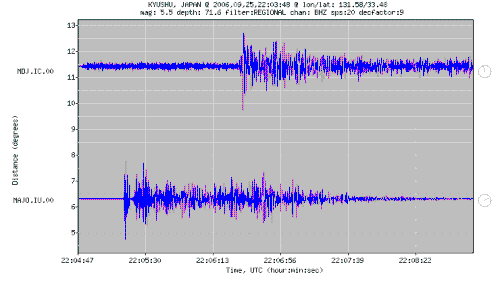
P waves are faster than S-waves, so will be the first to reach the station. It seems that for the North Korea event, a lot of the seismic energy received is in the first 10-15 seconds, and the signal dies out quite quickly after that. In contrast, the signal for the Japanese earthquake is received for more than 2 minutes, and the first peak is much less pronounced, suggesting that more energy is arriving in the form of slower S waves, and significant (above background) vibrations are received for a much longer period.
So, it seems likely that this is indeed an explosion, although that says nothing about whether the device actually worked; that would depend on knowing what the intended yield was, and even then it’s tricky, because not all of the energy released will be converted to seismic waves. This uncertainty may be behind the large discrepencies between the various estimates of the size of the explosion reported by New Scientist (see also the discussion at No Se Nada), which has led to speculation that the bomb might have ‘fizzled’. For what it’s worth, one of the textbooks on my desk says that a Hiroshima-size device (10-15 kT TNT equivalent) should generate a magnitude 5 quake, so if it didn’t fizzle, it seems to have been quite a small nuke.
Subscribe to:
Posts (Atom)