Showing posts with label climatology. Show all posts

06 February, 2007

Stalagmite records individual storms and intensities

In last months’ post about climate records from stalagmites and other speleothems, I concentrated on their potential for giving us detailed regional climate information over long time periods: 10s, and even 100s, of thousands of years. However, this article at Mongabay.com highlights some research concerned with records preserving climatic variations over much shorter timescales, and one of the more contentious issues in modern climate research: how the frequency and intensity of hurricanes is affected by our warming climate.

It seems that the towering storm clouds and humid atmosphere associated with hurricanes and other tropical cyclones produce rainwater which is extremely light isotopically (it has &delta18O 6 per mil more negative than normal precipitation), and a lot of it falls in a short time when a storm hits land. Amy Frappier and her colleagues decided to test if this pulse of storm water could affect the &delta18O of the groundwater enough to leave a signal in speleothems growing in underlying caves.

We used a computer-controlled dental drill to carefully mill off layers of powder from a fast-growing stalagmite [from Actun Tunichil Muknal caves, Belize], where each sample reflects cave drip water over periods of a week to a month. Analyzing these rock powders using standard techniques, we were able to detect brief spikes from recent hurricanes and tropical storms that produced rain over the cave - even when those storms struck only weeks apart!"

The effect is clearly illustrated by this figure from a paper Frappier et al. have just published in Geology [1]. Tropical cyclones which have hit Belize in the last 30 years (A) correlate well with short negative excursions in &delta18O (B). These excursions are superimposed on a longer-term pattern related to the El Nino Southern Oscillation (the 15 month offset with the El Nino record in C represents the time it takes rainwater to percolate from the surface to the cave). The accompanying carbon isotope record also shows the El Nino variation, probably due to changes in soil respiration rates, but not the storm events, showing that they are due to a separate forcing (heavy storm precipation).


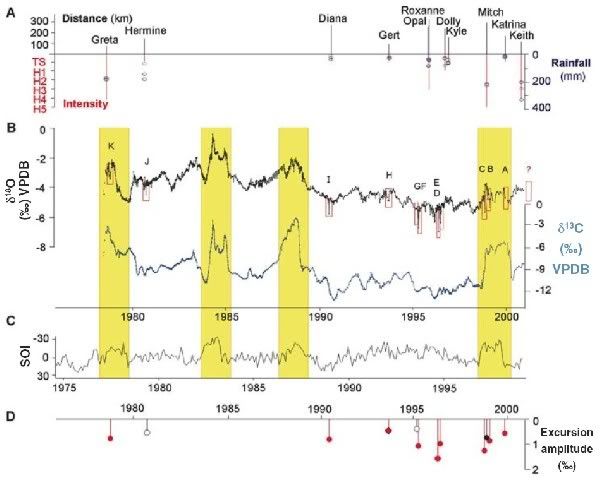
The final subfigure D is interesting, as it indicates that stronger storms (plotted in A) seem to produce larger excursions. Going back to the Mongabay piece:
"We also found that the relative size of spikes that we measured was related to the intensity of the storm, which is encouraging for the prospect of reconstructing the intensities of pre-historic landfalling storms.."

There’s currently a lot of debate over possible changes in storm numbers and/or intensity as a result of anthropogenic climate change (RealClimate has a good summary of the science) – some people claim there is already a clear signal, but others say that the historical data just isn’t good enough. Speleothem records can’t help resolve one of the major issues, the detection of non-landfalling storms, but it seems that they can potentially give us a much longer term record of trends in tropical cyclone intensity than is currently available; and a better idea of how much natural variability there was in the past can only help.

[1] Geology 35, p111-114 (doi).

This post was published on Day 2 of the Just Science challenge – a full week of science and only science. You can subscribe to the RSS feed at http://www.justscience.net/?feed=rss2.
All my posts for this week

25 January, 2007

Milankovitch goes solar?

From New Scientist:

Robert Ehrlich of George Mason University in Fairfax, Virginia, modelled the effect of temperature fluctuations in the sun's interior. According to the standard view, the temperature of the sun's core is held constant by the opposing pressures of gravity and nuclear fusion. However, Ehrlich believed that slight variations should be possible [due to instabilities caused by interactions with the Sun’s magnetic field]…

…Ehrlich's model shows that whilst most of these oscillations cancel each other out, some reinforce one another and become long-lived temperature variations. The favoured frequencies allow the sun's core temperature to oscillate around its average temperature of 13.6 million kelvin in cycles lasting either 100,000 or 41,000 years. Ehrlich says that random interactions within the sun's magnetic field could flip the fluctuations from one cycle length to the other.

These two timescales are instantly recognisable to anyone familiar with Earth's ice ages: for the past million years, ice ages have occurred roughly every 100,000 years. Before that, they occurred roughly every 41,000 years.


The paper is up on arXiv, and his model also has an oscillation in the 22,000 year range as well. This strikes me as a mighty big coincidence; it’s not like we’ve pulled the frequencies of variations in the Earth’s orbit - the Milankovitch cycles generally held to control long-term climate fluctuations - out of thin air. One thing I’d really like to know how sensitive the periods of these solar oscillations, if they exist, are to changes in the temperature structure of the sun, which I suspect we haven’t constrained with absolute precision. That said, a solar oscillation in the 100,000 year range might solve the problem of why it’s such a dominant signal in the climate record.

Anyone care to guess how long it will take for someone to claim this somehow has a bearing on the reality of anthropogenic climate change?

Update: Those of you who don't see the disconnect should head over to Open Mind for a clear explanation of why we think that the current short-term warning we're all worried about cannot be attributed to solar variability)

23 January, 2007

The writing in the cave walls

There’s a really nice post up on RealClimate about extracting climate records from stalagmites. Stalagmites and other speleothems form when water, percolating down from the surface and picking up dissolved carbon dioxide and other minerals on the way, penetrates into a cave system. When it reaches the cool, dry air of a cave, the carbon dioxide can escape from solution and carbonate minerals precipitate out. Take a steady drip of water, leave for a few thousand years, and voila:


The exciting part comes when we look at a cross-section through a stalagmite: just like tree rings, chemical changes in the different carbonate layers - particularly changes in the oxygen isotope values – reflect changes in the water falling on the land above the caves when that layer was deposited, and hence potentially give us high-resolution information about climatic variations over tens of thousands of years. Even better, you can determine the age of deposition using uranium-thorium dating; so what we potentially have is a source of climate records comparable to those we can get from ice cores (allowing us to independently check their chronologies), but globally distributed; you get caves on every continent, not just Antarctica and Greenland.

One thing this lets us look at is the variations in the strength of the monsoon through the last few glacial cycles. In the northern hemisphere summer, air rising above the warming land draws in moist air from the oceans to the south. The resulting rain is isotopically light (it has a negative &delta18O) because it has become fractionated by more evaporation and transport. A longer, wetter, stronger summer monsoon should therefore lead to lighter groundwater &delta18O than a shorter, drier, weaker, one; and that is exactly what we see in stalactites in the relevant regions. Here’s a record for most of the Holocene from Oman [1], showing both long term (over thousands of years) and short-term (over decadal and centennial timescales) variations in monsoon strength:


And here’s a longer term record, going back through a number of 21,000 year precessionary cycles, compiled from three overlapping stalagmite records from the Hulu Caves in China [2]. This second figure also plots the average summer insolation (black curve), and the Greenland ice core &delta18O (which tracks temperature – blue curve). The correlation is very good (especially if you look at a better version of the figure) – suggesting that the monsoon is stronger when it is warmer in Greenland. Centennial scale variations in Greenland have been linked to changes in the themohaline circulation, so these data give us some indication of the global effects such changes can have.


The variations in the monsoon being studied in these papers is a very strong climate signal, but as measurement and analytical methods get more sensitive and sophisticated (for example, the Hulu record has recently been extended back to 180,000 years ago [3]), tracking smaller regional variations in climate will become much easier. These results clearly show how, as this recent Science editorial [4] argues, “the age of the speleothem” could be upon us.

[1] Fleitmann et al., Science 300, 1737-1739 (2003)
[2] Wang et al/, Science 294, 2345-2348
[3] Hai Cheng et al., Geology 34, 217–220, 2006
[4] Henderson, Science 313, 620-622, 2006

02 November, 2006

THC not as weak as we thought (most of the time)

Following up from last month, the first results from the real-time monitoring of the thermohaline circulation were presented by Harry Bryden at the RAPID conference in Birmingham last week. I wasn’t there, so you should go to RealClimate and read Gavin’s analysis, as he was. This quote sums up the major news:


There were two key observations: first, that the approximations that had been used in the Bryden et al study were actually valid, and secondly, that the variations day by day varied by around 5 Sv (1 Sv is about 10 times the flow of the Amazon). The mean over the year for the MOC was 18 Sv.

It seems that over timescales of a few days there are fairly sizeable shifts in the amount of North Atlantic Deep Water (NADW) crossing the 25oN transect. These results pretty much destroy any hope of extracting any meaningful long-term trend from the existing data set of decadally spaced, one-time snapshots of the circulation; the ‘weakening’ from 23 to 15 Sv since 1957 proposed in Bryden et al.’s Nature paper last year is very close in magnitude to the observed natural variability (and their 2004 hydrographic section underestimated the average strength of the present circulation by 2 Sv). In an interview with the BBC, Bryden still seems fairly convinced there is some weakening of the circulation (by 10% in the last 25 years rather than 30%), but I think the jury’s out on even that at this stage.

I’m wondering whether Nature is going to follow up on the fact that one of their headline papers was a little premature (no luck so far...), but as Gavin points out, the media seem to have missed the down-sized estimate in their excitement over the curious 10 day period in November 2004 when the southwards flow of NADW was weak to non-existent (see here, for example). According to someone else I know who attended the talk, Harry Bryden ‘just dropped this in’, and it’s certainly not in his abstract. Why? Because at the moment no-one really has any idea how this could happen. To understand the confusion we need to look a little further north. NADW is principally formed by cold saline water sinking in the Norwegian Sea, but as the figures below shows, the route south is not simple, because it’s path is along the seabed is blocked by the Greenland-Scotland Ridge (GSR), part of the volcanic edifice which Iceland sits atop of. The top figure[1] shows how the GSR acts as a sort of dam, with three or four ‘sills’ at bathymetric lows acting as spillways which spilt the NADW into different currents. The bottom figure [2] shows how these currents all join back together at the southern end of Greenland and head south as one big water mass.

Why is this important? It means that the apparent shut down of the THC is not because there was a temporary hiatus in NADW production (due to, say, freshening of the surface waters due to particularly strong seasonal melting in the Artic). The different routes taken by the NADW over the GSR all take different times, so any cessation in downwelling would not simultaneously cut off all the currents coalescing south of Greenland. There will always be some water. So, if this is a real signal, the whole water mass seems to have somehow been held up in the northern Atlantic somewhere, which seems a little weird. We scientists like weird, or course, but at this stage we need more data: how often do these ‘mini-shutdowns’ happen? Are they seasonal/cyclical or random? I think much more interesting stuff is going to come out of this array over the next few years – not least a robust estimate of the longer term trends in the circulation.

Newer developments:
The Case of the THC "Shutdown"


[1] From Wright & Miller (1995), Paleoceanography 11(2), p157-170.
[2] From Dickson & Brown (1994), JGR 99(C6), p12319-41.

27 September, 2006

Mountain musings 1: The hard climb of science

I’ve just spent a week hiking in the Vanoise National Park; we did a five day loop around the main glacial massif. On the whole, it was a thoroughly enjoyable experience; after an unpromising start the weather was fabulous, the scenery fantastic (I took an old film camera so no photos to show off as yet) and I had the unforgettable experience of a golden eagle flying 10 feet above my head, close enough to pick out individual feathers on his underbelly. I’m glad I didn’t look like lunch, although his long stare indicated he was thinking about it.

The hike was no without it’s challenges, however, and the second day was particularly hard work. On paper, it was difficult enough; 1200 m of ascent, including a stiff climb to 2916 m to get across the Col d’Aussois. In reality, we proceeded to make it even tougher for ourselves by getting un peu perdu. As we approached the Col, we lost the trail, but we could see a track going up the hillside across the river and decided that must be the route. We persevered with this belief even after we discovered that the bridge promised in our guidebook had apparently vanished; it was only when we’d spent an hour struggling up it - and reached a much lower col on the wrong side of some rather hefty mountains – that we realised that we’d gone a bit wrong. When we looked back into the valley, we could see the actual track, heading upwards into the next valley. Merde.

Fortunately, our elevated perspective also showed us that we didn’t have to completely retrace our steps, an option almost as unpalatable as heading on and trying to find another route across the ridge; instead, we just had to descend enough to contour around into the next valley, and then re-ascend to rejoin the trail up to the Col d’Aussois after it crossed the river (on a very existent bridge). Despite this short cut we lost almost two hours, and fretting over time combined with tiredness from our abortive first ascent, the altitude, and an unrelentingly steep path to make the ascent to the top of the proper col one of the toughest things I’ve done in quite a while. My world contracted in on itself; the track was reasonably well marked by cairns, and rather than focussing on the distance to the summit, my mind was fixated on driving myself onward to the next cairn, and then the next one, and then the next one… all the time my breath was getting shorter, my rucksack was getting apparently heavier, and lifting my feet was becoming ever more difficult. And then, just when I thought I’d reached the top, I struggled over the break in slope to discover yet more up. By this stage, it’s only slightly melodramatic to claim that the point of the ascent was only a dim recollection in the back of my mind; pretty much the only thought in my head was, “I’m not going to let this bloody hill beat me!”

By 7.30, we’d all got to the top. Unfortunately, that was not the end; we now had to descend down to the refuge on the other side of the col. Down was good (although gravity can be a fickle friend when you’re knackered), but we had the small problem of about 90 minutes’ walking and half an hour of daylight left to do it in. Fortunately, thanks to one of my companion’s inspired twilight route-finding, we only needed our torches for the last 20 minutes, but even so we almost overshot our destination.

In the end, what should have been an eight hour trek had taken almost 12. However, although negotiating mountain trails in the dark is hardly recommended, we were never really in serious trouble; as a tale of danger and fortitude, this is hardly Touching the Void territory. However, looking back as the hike continued, I found myself thinking back to a post I started writing a few weeks back, discussing the vast gulf between the public perception of science and the process of actually doing science*, and I couldn’t help drawing parallels between that the physical ordeal of that day and the mental struggle of a PhD, or any research project. You start at the bottom of a big hill, and despite previous research as a guide the way forward is not clear (especially if you don’t find the key publication, as we neglected to properly consult the map). When a route does present itself, it may not be the correct one, and it may take you considerable time and effort to discover this. Your wrong paths may not be a complete dead end; a negative result can still constrain the problem, or (as happened during my PhD), the result which undermines a key assumption may finally reveal the true path to understanding. It’s disturbingly easy to get so lost in the day-to-day grind of generating and processing data, that you almost lose sight of the reasons you were interested in the first place. Just when you think you’ve got there, you discover a new complication with your data. And, of course, it takes much longer than it was supposed to.

If I really wanted to get lost in the metaphor, I could run with the whole “standing on the shoulders of giants” angle by musing that the hard day’s climbing gave us access to some spectacular mountain scenery in the following days. That, however, is somewhat immaterial to my point. I’ve often thought that a shortcoming of most science reporting, centred as it is around (if we’re lucky, informed) regurgitation of Nature press releases, is that it is exclusively concerned with the outcomes: the exciting results and nifty new hypotheses. Results are important, of course, but I sometimes think that focussing only on the final part of the scientific process means that many people do not realise exactly how many years’ graft has gone into attracting the public attention for that fleeting second (if it ever does). A scientist’s week does not consist of thinking up a nifty idea on Monday, running down to the lab and testing it on Tuesday and Wednesday, writing it up on Thursday and getting the plaudits on Friday. The view is great from the top - but it takes a whole lot of climbing to get there.

*Yes, I was thinking about blogging. But a nice walk has always provided good thinking time for me, so it’s not quite as sad as it might appear. Honest.

01 September, 2006

The long road to ozone hole recovery

I'm somewhat late commenting on the story that the Antarctic ozone hole appears to have stopped growing, but I put together this figure last week by pulling images off the NASA Ozone Hole Watch website (click here for the latest image from this year), and it seems a shame to waste it. It depicts how the springtime concentration of ozone over the south pole has varied since 1979. Blue and purple indicate low ozone concentrations, green and yellow high concentrations.


This figure provides a qualitative impression - that the area of ozone depletion in the 2005 season was not enormously bigger or deeper than in 1999, and in fact appeared to recover a little earlier. This impression is confirmed by the more rigorous (but less pretty) figure below, which shows the annual variation in the size of the ozone hole since 1979 - click on it for the original (and clearer) version at this NASA site, where you can also see how the severity of ozone depletion has varied.


So it seems that in fact things have been stabilising for a while now - the sudden media interest can be traced to a NOAA press release to mark the 20 year anniversary of the study that confirmed that chlorine, released when CFCs are broken down by ultraviolet radiation, was the cause of ozone depletion above Antarctica. This work combined with a rare outbreak of non-partisan international cooperation to produce the Montreal Protocol. Even more remarkably, the agreement was actually pretty effective at curtailing the production of CFCs and other ozone-damaging chemicals:


(source)

However, the important thing to notice is that the thinning of the ozone layer above Antartica continued throughout the 1990s; although we cut the production of ozone-destroying chemicals, the molecules of those we have already released are persistant beasties, surviving in the atmosphere for anything up to 100 years. Indeed, as the graph here shows, the atmospheric concentration of flourocarbons has merely stablised in the last decade. Until it begins to fall, springtime ozone depletion above the Antarctic will continue (the latest research estimates full recovery in about 2065). The fact that our atmosphere is still suffering the consequences of CFC emitted two decades ago is a warning about the consequences of the other changes we have wrought on atmospheric chemisty. Even if we can agree to seriously cut the emission of greenhouse gases in the next decade or two, the full effect of what we've already emitted, and are currently emitting, will not play out for a long time afterwards (especially since climate change affects the ocean, which responds over timescales of centuries, not decades). More people need to realise that emissions cuts will not put the brakes on climate change; it is more akin to taking your foot off the accelerator.

28 January, 2006

In memory of Nick Shackleton

Nick Shackleton, one of the pioneers of palaeoclimate research, died last week. By developing the methods required to measure oxygen isotope variations in ocean sediment cores (or, more correctly, in the shells of foraminifera which were preserved in them), he was able to construct a complete record of the waxing and waning of the polar ice sheets. He further showed that these changes could be linked to variations in the shape of the Earth's orbit and could thus be used as a basis for dating the cores. Isotope stratigraphy is now routinely used by scientists worldwide to date and correlate past climate changes.

One of the things that I really enjoyed as an undergraduate at Cambridge was the fact that lectures were given by people at the top of their field; if you want to to enthuse and excite the students, nothing beats someone who is enthused and excited themself telling you about their research. It was no therefore no surpise that the isotope stratigraphy lectures were handled by Nick himself. He was the archetypal academic, sandals and all, and prone to go off on a tangent in the middle of a lecture; but just being in the same room as someone of his stature was an experience. In fact, he and his cohorts almost convinced me to go down the palaeoceanography path, until I found how much I disliked picking forams.

The Cambridge Quarternary Group have a more detailed summary of his life and work here, and have posted some of the tributes which they have received since his death here.

It is sad news, but Professor Shackleton developed an entire subdiscipline of Earth Science and worked at the forefront of it until he died, made a number of fundamental contributions to our understanding of the planet's climatic history, and is warmly remembered by all. That's not a bad legacy.

25 January, 2006

What, no polar bears?

A couple of weeks ago, I discussed Bryden et al.'s widely reported Nature paper, which claimed a significant slowdown in the thermohaline circulation, and suggested that we're going to have to wait to see whether the results reflect a real trend, or are just a combination of error and natural variability in a poorly described system. All very well, but then I concluded:

In a couple of years, maybe we'll know whether I'll retire to vineyards or polar bears in my back garden.
Flippant, perhaps, and as it turns out also rather foolish. Via Real Climate, I've just come across a nice discussion (subscription required, I'm afraid) of how, even if the conveyor is slowing, its impact is not quite as simple as on=vineyards, off=polar bears.

One interesting aspect of this article is the caution with which most climate scientists are treating these results. Some example comments:

  • "The story is appealing, but it is a very extreme interpretation of the data."
  • "Bryden's results are extraordinary, but this is exactly why they require extraordinary evidence."

If nothing else, this shows exactly how slanderous so-called 'critics' are being when they accuse climate scientists of being more interested in playing politics than objective scientific analysis. If all they were interested in was scaring people into their liberal, social-engineered worldview and securing research funding, such data is an open goal for spinning any number of apocalyptic scenarios, a la James Lovelock. Instead, they are quite open about their doubts, which stem from two main sources. The first is observational: a reduced thermohaline circulation should reduce heat transport into the North Atlantic, but there has been no drop in high latitude sea surface temperatures, and Europe has been warming, not cooling, in the last decade. Secondly, the estimated increase in fresh water added to the surface North Atlantic is lower, by an order of magnitude, than that required by modelling to stop NADW formation. Much more warming is required before the thermohaline circulation should be seriously affected.

But going back to the quote from my previous post, the other message from this article is that although reduced NADW formation can be linked to cooling of Europe in the past, it is by no means clear that a shutdown will also lead to cooling in the future, and in fact most modelling seems to indicate it will not. At the end of the last Ice Age many think that the presence of sea ice provided an important positive feedback (through both the familiar ice-albedo effect, and by preventing heat transfer between ocean and atmosphere) which exacerbated cooling in response to slowing of the thermohaline circulation; our present warming climate reduces sea ice cover and hence the effectiveness of this mechanism. As Wally Broecker, one of the pioneers of this whole idea, puts it:
"The notion that a collapse of the thermohaline circulation may trigger a mini ice age is a myth."
But even if the local effects we might have expected may not be on the cards, this does not mean that we should not be concerned: the thermohaline circulation also plays an important role in supplying nutrient rich bottom water to many parts of the world, and additionally enhances the ability of the oceans to absorb CO2 from the atmosphere (by transferring dissolved CO2-rich water to the deep ocean). A shutdown could still have serious consequences. But, whatever happens, it appears that my garden will remain polar bear free.

Newer developments:
The Case of the THC "Shutdown"
THC not as weak as we thought - most of the time

08 January, 2006

The Decade After Tomorrow?

Authors note: This post was mostly written before Christmas, but I then got distracted and didn't get the chance to finish it. I guess it's a bit less topical now but I don't like to waste hard-written words...

What does the the paper published in Nature last month by Bryden et al.[1] have in common with a recent Hollywood disaster movie? Answer: before The Day After Tomorrow descended into 3000km-wide superstorms sucking down air from the stratosphere and turning everybody into icicles (casually breaking the laws of thermodynamics in the process), both are concerned with a possible weakening of the thermohaline circulation in response to climate change.

However much we moan about the weather here in the UK, we should bear in mind that we are located roughly as far north as Hudson Bay. Which, it could be argued, is a tad cooler than here. The reason for this is that we (and the rest of Western Europe) benefit from the Gulf Stream, a strong current of warm surface water that flows from the Gulf of Mexico to the northeast Atlantic, bringing a lot of heat from the tropics with it. A large part of this north-eastward flow is wind-driven, but not all of it is. In the current climate system, heat loss and evaporation causes seawater in the northern Atlantic, particularly in the Nordic and Labrador Seas, to become so cold and salty, and therefore dense, that it sinks into the deep ocean and moves south back towards the equator below the surface currents, at depths of several thousand metres. About 20-30% of the total northward flow of water in the Gulf Stream is moving to replace the downwelling water in the North Atlantic as part of this 'thermohaline circulation'; the additional heat transfer from equatorial regions, and the penetration of warm water to much higher latitudes than would result from wind-driven flow alone, combine to produce much higher seasonal temperatures on our side of the Atlantic.

Looking back into the past, we can see a link between the strength of the thermohaline circulation and high latitude temperatures in the Northern Hemisphere. The sinking water in the Nordic and Labrador seas - often referred to as the North Atlantic Deep Water (NADW) has chemical properties which make it distinct from, for example, water from the oceans around Antarctica, or the Pacific. By taking sediment cores from the South Atlantic and chemically analysing shells or minerals that formed in ancient seas thousands of years ago, the penetration of the NADW into this region, which is greater when the thermohaline circulation is stronger, can be estimated (e.g. [2]). Such studies show that at the end of the last Ice Age, about 19,000 years ago, when glaciers covered much of northern Europe, the thermohaline circulation was much weaker than today, and strengthened over the next 10,000 years as we moved into the present (warm) Holocene period. More significantly, the sediment cores also indicate rapid oscillations in the penetration of NADW, where the thermohaline circulation suddenly got much stronger or weaker - oscillations which can be correlated to abrupt warming or cooling events in the northern hemisphere. These variations apparently occurred over very short timescales - certainly not three days, as a certain movie would have you believe, but in the course of decades, still extremely fast by geological standards.

The current warming trend is making surface waters in the North Atlantic less saline (and therefore less dense) by adding large amounts of fresh water - for example, from the melting of the Greenland icecap. This can potentially reduce NADW formation by weakening downwelling. Models of the thermohaline circulation suggest that once enough meltwater is added, the circulation abruptly collapses into a much weaker current. Furthermore, this change is not reversible - the density of surface waters has to increase substantially before vigorous NADW formation restarts.

Whilst this is all very worrying, up until now there has been no real indication that the increased supply of meltwater to the North Atlantic has been having the predicted effect. Now, however, Bryden et al. report the results of the latest of a series of east-west transects (starting in 1957, with the most recent in 1998 and 2004), measuring variations of water temperature and salinity with depth at various points, across the Atlantic Ocean at 25 degrees North. These measurements can be used to calculate the 'geostrophic flow': Coriolis forces caused by the Earth's rotation mean that north- or south- flowing currents in the Atlantic oceans generate east-west pressure gradients, which can be calculated from the temperature and salinity profiles (in case that made no sense whatsoever - not unlikely - this post at realclimate.org is a good starting point). Compared to the previous transects, results from the latest one in 2004 appear to show a 50% reduction in the southward flow of water between 3000 and 5000 m depth, which is sourced from downwelling water in the Norwegian Sea.

However, before you start investing wholesale in your uncle's woolly hat company, it's worth reading the small print. Because the current strengths are being estimated by an indirect method, the potential errors are quite large; in fact, the authors estimate that the error is about the same size as the apparent decrease in NADW flow. They also argue that because the observed reduction is associated with a particular component of the flow, rather than distributed at all levels, the effect is real, which is a fair point but not a conclusive one. The other problem is that there is virtually no data on the natural variability of the thermohaline circulation, so it is also possible that the most recent survey is just detecting this rather than a sustained reduction.

These caveats make it hard to really assess the significance of these results. But watch this space - the cruise which collected the data for this study was part of a programme to deploy a series of buoys along the 25N transect, which will continuously monitor the thermohaline circulation. This system will give a much better idea of the seasonal variability of the thermohaline circulation, and also reduce the errors in estimates of its strength. In a couple of years, maybe we'll know whether I'll retire to vineyards or polar bears in my back garden.

Newer developments:
The Case of the THC "Shutdown"
THC not as weak as we thought - most of the time
What, no polar bears?


[1] Bryden et al (2005). Nature 381, p655-657.
[2] Piotrowski et al. (2004). Earth and Planetary Science Letters 225, p205-220.