


There’s a really nice post up on RealClimate about extracting climate records from stalagmites. Stalagmites and other speleothems form when water, percolating down from the surface and picking up dissolved carbon dioxide and other minerals on the way, penetrates into a cave system. When it reaches the cool, dry air of a cave, the carbon dioxide can escape from solution and carbonate minerals precipitate out. Take a steady drip of water, leave for a few thousand years, and voila:
The exciting part comes when we look at a cross-section through a stalagmite: just like tree rings, chemical changes in the different carbonate layers - particularly changes in the oxygen isotope values – reflect changes in the water falling on the land above the caves when that layer was deposited, and hence potentially give us high-resolution information about climatic variations over tens of thousands of years. Even better, you can determine the age of deposition using uranium-thorium dating; so what we potentially have is a source of climate records comparable to those we can get from ice cores (allowing us to independently check their chronologies), but globally distributed; you get caves on every continent, not just Antarctica and Greenland.
One thing this lets us look at is the variations in the strength of the monsoon through the last few glacial cycles. In the northern hemisphere summer, air rising above the warming land draws in moist air from the oceans to the south. The resulting rain is isotopically light (it has a negative &delta18O) because it has become fractionated by more evaporation and transport. A longer, wetter, stronger summer monsoon should therefore lead to lighter groundwater &delta18O than a shorter, drier, weaker, one; and that is exactly what we see in stalactites in the relevant regions. Here’s a record for most of the Holocene from Oman [1], showing both long term (over thousands of years) and short-term (over decadal and centennial timescales) variations in monsoon strength: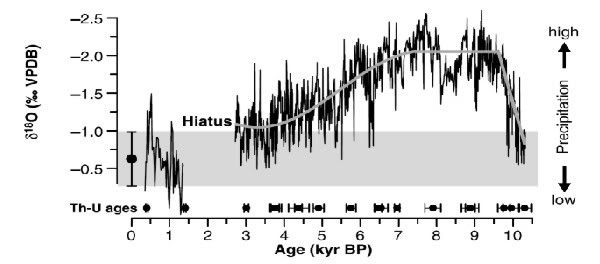
And here’s a longer term record, going back through a number of 21,000 year precessionary cycles, compiled from three overlapping stalagmite records from the Hulu Caves in China [2]. This second figure also plots the average summer insolation (black curve), and the Greenland ice core &delta18O (which tracks temperature – blue curve). The correlation is very good (especially if you look at a better version of the figure) – suggesting that the monsoon is stronger when it is warmer in Greenland. Centennial scale variations in Greenland have been linked to changes in the themohaline circulation, so these data give us some indication of the global effects such changes can have. 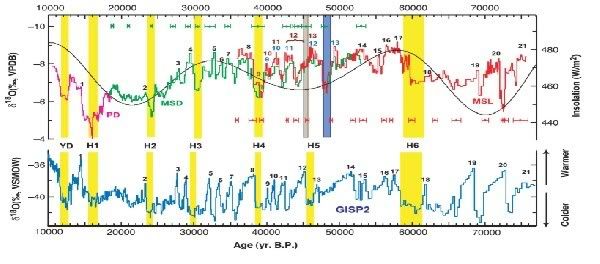
The variations in the monsoon being studied in these papers is a very strong climate signal, but as measurement and analytical methods get more sensitive and sophisticated (for example, the Hulu record has recently been extended back to 180,000 years ago [3]), tracking smaller regional variations in climate will become much easier. These results clearly show how, as this recent Science editorial [4] argues, “the age of the speleothem” could be upon us.
[1] Fleitmann et al., Science 300, 1737-1739 (2003)
[2] Wang et al/, Science 294, 2345-2348
[3] Hai Cheng et al., Geology 34, 217–220, 2006
[4] Henderson, Science 313, 620-622, 2006
23 January, 2007
The writing in the cave walls
![]()
Subscribe to:
Post Comments (Atom)
No comments:
Post a Comment